

Kinross reports 2024 fourth-quarter and full-year results
/EIN News/ -- Delivered on all key guidance metrics
Achieved record free cash flow of more than $1.3 billion and repaid $800 million of debt
Strong three-year outlook of 2.0 million Au eq. oz. per year
TORONTO, Feb. 12, 2025 (GLOBE NEWSWIRE) -- Kinross Gold Corporation (TSX: K, NYSE: KGC) (“Kinross” or the “Company”) today announced its results for the fourth quarter and year ended December 31, 20241.
This news release contains forward-looking information about expected future events and financial and operating performance of the Company. We refer to the risks and assumptions set out in our Cautionary Statement on Forward-Looking Information located on pages 41 and 42 of this release. All dollar amounts are expressed in U.S. dollars, unless otherwise noted.
2024 full-year results and 2025 guidance:
|
2024 guidance (+/- 5%) |
Q4 2024 results |
2024 full-year results |
2025 guidance (+/- 5%) |
|
|
Gold equivalent production1 (ounces) |
2.1 million | 501,209 | 2.13 million | 2.0 million |
|
Production cost of sales2 Attributable production cost of sales1 ($ per Au eq. oz.) |
- $1,020 |
$1,098 $1,096 |
$1,020 $1,021 |
- $1,120 |
|
Attributable all-in sustaining cost1 ($ per Au eq. oz.) |
$1,360 | $1,510 | $1,388 | $1,500 |
|
Capital expenditures3 Attributable capital expenditures1 (million) |
- $1,050 |
$281 $279 |
$1,076 $1,051 |
- $1,150 |
- Kinross has forecasted stable production guidance of approximately 2.0 million attributable Au eq. oz. (+/- 5%) in 2026 and 2027.
2024 Q4 and full-year highlights:
- Margins4 of $1,565 per Au eq. oz. sold in Q4 2024, and $1,373 for 2024.
- Operating cash flow5 of $734.5 million in Q4 2024, and $2,446.4 million in 2024.
- Attributable free cash flow1 was $434.4 million in Q4 2024, and $1,340.2 million in 2024, both of which are Company records.
- Reported net earnings6 of $275.6 million in Q4 2024, or $0.22 per share, and $948.8 million, or $0.77 per share, in 2024.
- Adjusted net earnings7, 8 of $240.0 million, or $0.20 per share in Q4 2024, and $838.3 million, or $0.68 per share, in 2024.
- Cash and cash equivalents of $611.5 million, and total liquidity9 of $2.3 billion at December 31, 2024. The Company also continued to prioritize debt reduction, repaying the remaining balance on its term loan on February 10, 2025.
- Kinross’ Board of Directors declared a quarterly dividend of $0.03 per common share payable on March 20, 2025, to shareholders of record at the close of business on March 5, 2025.
- Catherine McLeod-Seltzer has announced that she will not be standing for election. Kelly Osborne, a Board member since 2015, has been approved as Chair of the Board, effective upon his re-election.
________________________
1 Unless otherwise stated, production figures in this news release are on an attributable basis. “Attributable” includes Kinross’ 70% share of Manh Choh production, costs and capital expenditures. Financial figures include 100% of Manh Choh results except when denoted as attributable. Attributable figures are non-GAAP financial measures and ratios. Refer to footnote 7.
2 “Production cost of sales per equivalent ounce sold” is defined as production cost of sales, as reported on the consolidated statements of operations, divided by total gold equivalent ounces sold.
3 Capital expenditures is reported as "Additions to property, plant and equipment" on the consolidated statements of cash flows.
4 “Margins” per equivalent ounce sold is defined as average realized gold price per ounce less production cost of sales per equivalent ounce sold.
5 Operating cash flow figures in this release represent “Net cash flow provided from operating activities,” as reported on the consolidated statements of cash flows.
6 Earnings, net earnings, and reported net earnings figures in this release represent “Net earnings attributable to common shareholders,” as reported on the consolidated statements of operations.
7 These figures are non-GAAP financial measures and ratios, as applicable. They are defined and actual results are reconciled on pages 25 to 31 of this news release. Non-GAAP financial measures and ratios have no standardized meaning under International Financial Reporting Standards “IFRS” and therefore, may not be comparable to similar measures presented by other issuers.
8 Adjusted net earnings figures in this news release represent “Adjusted net earnings attributable to common shareholders.”
9 “Total liquidity” is defined as the sum of cash and cash equivalents, as reported on the consolidated balance sheets, and available credit under the Company’s credit facilities (as calculated in Section 6 Liquidity and Capital Resources of Kinross’ MD&A for the year ended December 31, 2024).
Operational highlights:
- Tasiast delivered record throughput, production and cash flow in 2024, and was the highest-margin operation.
- Paracatu had another strong year, delivering over 500,000 gold ounces for the 7th consecutive year.
- Fort Knox significantly increased annual production as a result of first gold from Manh Choh in Q3 2024.
Development project and exploration highlights:
- At Great Bear, the Advanced Exploration (AEX) program is making strong progress with early works underway.
- At Bald Mountain, approved the Redbird pit, extending mine life and adding ~1 million gold ounces to reserves.
- At Lobo-Marte, the dedicated project team is progressing baseline studies to support permitting.
- At Round Mountain Phase X, wide, high-grade intercepts in upper and lower targets, confirming exploration thesis.
- At Curlew, exploration efforts resulted in high-grade, high-quality resource growth.
CEO Commentary:
J. Paul Rollinson, CEO, made the following comments in relation to 2024 fourth-quarter and year-end results:
“2024 marked another excellent year for Kinross and we have, once again, met our production and cost guidance. We delivered record free cash flow7 of $1.3 billion, which more than doubled year-over-year, repaid $800 million of debt, and grew our margins by 37%, significantly outpacing the rise in gold price.
“Three years ago, in February 2022, we acquired Great Bear through a combination of cash and shares. I’m proud to say that, since then, we have fully repaid the debt associated with that acquisition and have fewer shares outstanding due to our share buyback program. We have also outlined a high-grade resource and published an attractive Preliminary Economic Assessment demonstrating top-tier, high-margin production potential.
"We converted nearly 1 million resource ounces to reserves at Bald Mountain, which, coupled with the receipt of our Juniper permit in 2024, resulted in the decision to proceed with mining at Redbird.
“In Sustainability, we advanced environmental, social and governance initiatives across our host countries and look forward to publishing our detailed 2024 Sustainability Report in May. Highlights from 2024 include:
- Completed more than 15 energy efficiency projects across the portfolio and on track to achieve 30% reduction in emissions intensity by 2030;
- Provided flood relief aid to communities in the south of both Mauritania and Brazil; and
- Recognized as the top gold company and in the top 10% overall in The Globe and Mail’s corporate governance ranking.
“We are forecasting another strong year of production of approximately 2.0 million gold equivalent ounces while maintaining our consistent operational performance. Our operational focus in 2025 will be on cost control, capital discipline and delivering on planned grades. We are also anticipating additional returns of capital to shareholders later in 2025.”
Financial results
Summary of financial and operating results
| Three months ended | Years ended | |||||||||
| (in millions of U.S. dollars, except ounces, per share amounts, and per ounce amounts) | December 31, | December 31, | ||||||||
| 2024 | 2023 | 2024 | 2023 | |||||||
| Operating Highlights(a) | ||||||||||
| Total gold equivalent ounces(b) | ||||||||||
| Produced | 514,355 | 546,513 | 2,170,791 | 2,153,020 | ||||||
| Sold | 531,729 | 565,389 | 2,153,212 | 2,179,936 | ||||||
| Attributable gold equivalent ounces(b) | ||||||||||
| Produced | 501,209 | 546,513 | 2,128,052 | 2,153,020 | ||||||
| Sold | 517,980 | 565,389 | 2,111,688 | 2,179,936 | ||||||
| Earnings(a) | ||||||||||
| Metal sales | $ | 1,415.8 | $ | 1,115.7 | $ | 5,148.8 | $ | 4,239.7 | ||
| Production cost of sales | $ | 583.8 | $ | 552.0 | $ | 2,197.1 | $ | 2,054.4 | ||
| Depreciation, depletion and amortization | $ | 284.8 | $ | 271.7 | $ | 1,147.5 | $ | 986.8 | ||
| Impairment charge (reversal) | $ | - | $ | 38.9 | $ | (74.1 | ) | $ | 38.9 | |
| Operating earnings | $ | 501.1 | $ | 193.5 | $ | 1,540.3 | $ | 801.4 | ||
| Net earnings attributable to common shareholders | $ | 275.6 | $ | 65.4 | $ | 948.8 | $ | 416.3 | ||
| Basic and diluted earnings per share attributable to common shareholders | $ | 0.22 | $ | 0.06 | $ | 0.77 | $ | 0.34 | ||
| Adjusted net earnings attributable to common shareholders(c) | $ | 240.0 | $ | 140.0 | $ | 838.3 | $ | 539.8 | ||
| Adjusted net earnings per share(c) | $ | 0.20 | $ | 0.11 | $ | 0.68 | $ | 0.44 | ||
| Cash Flow(a) | ||||||||||
| Net cash flow provided from operating activities | $ | 734.5 | $ | 410.9 | $ | 2,446.4 | $ | 1,605.3 | ||
| Attributable adjusted operating cash flow(c) | $ | 614.1 | $ | 409.6 | $ | 2,143.1 | $ | 1,676.7 | ||
| Capital expenditures(d) | $ | 280.7 | $ | 311.3 | $ | 1,075.5 | $ | 1,098.3 | ||
| Attributable capital expenditures(c) | $ | 278.8 | $ | 297.7 | $ | 1,050.9 | $ | 1,055.0 | ||
| Attributable free cash flow(c) | $ | 434.4 | $ | 116.7 | $ | 1,340.2 | $ | 559.7 | ||
| Per Ounce Metrics(a) | ||||||||||
| Average realized gold price per ounce(e) | $ | 2,663 | $ | 1,974 | $ | 2,393 | $ | 1,945 | ||
| Attributable average realized gold price per ounce(c) | $ | 2,665 | $ | 1,974 | $ | 2,391 | $ | 1,945 | ||
| Production cost of sales per equivalent ounce(b) sold(f) | $ | 1,098 | $ | 976 | $ | 1,020 | $ | 942 | ||
| Attributable production cost of sales per equivalent ounce(b) sold(c) | $ | 1,096 | $ | 976 | $ | 1,021 | $ | 942 | ||
| Attributable production cost of sales per ounce sold on a by-product basis(c) | $ | 1,069 | $ | 936 | $ | 988 | $ | 892 | ||
| Attributable all-in sustaining cost per equivalent ounce(b) sold(c) | $ | 1,510 | $ | 1,353 | $ | 1,388 | $ | 1,316 | ||
| Attributable all-in sustaining cost per ounce sold on a by-product basis(c) | $ | 1,490 | $ | 1,328 | $ | 1,365 | $ | 1,284 | ||
| Attributable all-in cost per equivalent ounce(b) sold(c) | $ | 1,868 | $ | 1,709 | $ | 1,739 | $ | 1,634 | ||
| Attributable all-in cost per ounce sold on a by-product basis(c) | $ | 1,854 | $ | 1,699 | $ | 1,725 | $ | 1,619 | ||
(a) All measures and ratios include 100% of the results from Manh Choh, except measures and ratios denoted as “attributable.” “Attributable” measures and ratios include Kinross’ 70% share of Manh Choh production, sales, cash flow, capital expenditures and costs, as applicable.
(b) “Gold equivalent ounces” include silver ounces produced and sold converted to a gold equivalent based on a ratio of the average spot market prices for the commodities for each period. The ratio for the fourth quarter and full year 2024 was 84.67:1 and 84.43:1, respectively (fourth quarter and full year 2023 – 85.00:1 and 83.13:1, respectively).
(c) The definition and reconciliation of these non-GAAP financial measures and ratios is included on pages 25 to 31 of this news release. Non-GAAP financial measures and ratios have no standardized meaning under IFRS and therefore, may not be comparable to similar measures presented by other issuers.
(d) “Capital expenditures” is as reported as “Additions to property, plant and equipment” on the consolidated statements of cash flows.
(e) “Average realized gold price per ounce” is defined as gold revenue divided by total gold ounces sold.
(f) “Production cost of sales per equivalent ounce sold” is defined as production cost of sales divided by total gold equivalent ounces sold.
The following operating and financial results are based on fourth-quarter and year-end 2024 gold equivalent production:
Production: Kinross produced 501,209 Au eq. oz. in Q4 2024, compared with 546,513 Au eq. oz. in Q4 2023.
Over the full year, Kinross produced 2,128,052 Au eq. oz., largely in line with full-year 2023 production of 2,153,020 Au eq. oz.
Average realized gold price10: The average realized gold price in Q4 2024 was $2,663 per ounce, compared with $1,974 per ounce in Q4 2023. For full-year 2024, the average realized gold price per ounce was $2,393, compared with $1,945 per ounce for full-year 2023.
Revenue: During the fourth quarter, revenue increased to $1,415.8 million, compared with $1,115.7 million during Q4 2023. Revenue increased to $5,148.8 million for full-year 2024, compared with $4,239.7 million for full-year 2023. The 21% year-over-year increase is primarily due to the increase in the average realized gold price.
Production cost of sales: Production cost of sales per Au eq. oz.2 sold was $1,098 for Q4 2024, compared with $976 in Q4 2023. Production cost of sales per Au eq. oz.2 sold was $1,020 for full-year 2024, compared with $942 for full-year 2023.
Attributable production cost of sales per Au eq. oz. sold1 was $1,096 in Q4 2024, compared with $976 in Q4 2023, based on attributable gold sales of 517,980 ounces. Attributable production cost of sales per Au eq. oz. sold1 was $1,021 for full-year 2024, compared with $942 for full-year 2023, based on attributable gold sales of 2,111,688.
Margins4: Kinross’ margin per Au eq. oz. sold was $1,565 for Q4 2024, compared with the Q4 2023 margin of $998. Full-year 2024 margin per Au eq. oz. sold was $1,373, compared with $1,003 for full-year 2023.
Attributable all-in sustaining cost1: Attributable all-in sustaining cost per Au eq. oz. sold was $1,510 in Q4 2024, compared with $1,353 in Q4 2023. Full-year attributable all-in sustaining cost per Au eq. oz. sold was $1,388, compared with $1,316 for full-year 2023.
In Q4 2024, attributable all-in sustaining cost per Au oz. sold on a by-product basis1 was $1,490, compared with $1,328 in Q4 2023. Attributable all-in sustaining cost per Au oz. sold on a by-product basis1 was $1,365 for full-year 2024, compared with $1,284 in 2023.
Operating cash flow5: Operating cash flow was $734.5 million for Q4 2024, compared with $410.9 million for Q4 2023. Operating cash flow for full-year 2024 was $2,446.4 million, compared with $1,605.3 million for full-year 2023, primarily due to the increase in margins and favourable working capital movements.
Attributable adjusted operating cash flow1 for Q4 2024 was $614.1 million, compared with $409.6 million for Q4 2023. Attributable adjusted operating cash flow1 for full-year 2024 was $2,143.1 million, compared with $1,676.7 million in 2023.
Attributable free cash flow1: Record attributable free cash flow was $434.4 million in Q4 2024, compared with $116.7 million in Q4 2023. Record attributable free cash flow for full-year 2024 was $1,340.2 million compared with attributable free cash flow of $559.7 million in 2023.
Earnings6: Reported net earnings were $275.6 million for Q4 2024, or $0.22 per share, compared with reported net earnings of $65.4 million, or $0.06 per share, for Q4 2023. Full year reported net earnings in 2024 were $948.8 million, or $0.77 per share, compared with reported net earnings of $416.3 million, or $0.34 per share, in 2023.
Adjusted net earnings7, 8 were $240.0 million, or $0.20 per share, for Q4 2024, compared with $140.0 million, or $0.11 per share, for Q4 2023. Full-year adjusted net earnings7, 8 were $838.3 million, or $0.68 per share, compared with $539.8 million, or $0.44 per share, for full-year 2023.
Attributable capital expenditures1: Attributable capital expenditures were $278.8 million for Q4 2024, compared with $297.7 million for Q4 2023. Attributable capital expenditures for full-year 2024 were $1,050.9 million, compared with $1,055.0 million in 2023, which included the start of Phase S development at Round Mountain, continued work at Great Bear, and increased capital development at Tasiast for West Branch 5.
________________________
10 “Average realized gold price per ounce” is defined as gold revenue divided by total gold ounces sold.
Balance sheet
The Company continued to strengthen its balance sheet by repaying $250.0 million on its term loan in the quarter, totalling $800.0 million during 2024. The Company repaid the remaining $200.0 million on February 10, 2025, completing repayment of the $1.0 billion term loan.
Kinross had cash and cash equivalents of $611.5 million as of December 31, 2024, compared with $352.4 million at December 31, 2023.
The Company had additional available credit11 of $1.65 billion as of December 31, 2024, and total liquidity9 of approximately $2.3 billion.
________________________
11 “Available credit” is defined as available credit under the Company’s credit facilities and is calculated in Section 6 Liquidity and Capital Resources of Kinross’ MD&A for the year ended December 31, 2024.
Return of capital
Kinross is committed to enhancing shareholder returns through its continuing quarterly dividend. The dividend of $0.03 per common share is payable on March 20, 2025, to shareholders of record as of March 5, 2025.
Kinross is currently in the process of renewing its normal course issuer bid with the Toronto Stock Exchange, and at current gold prices, intends to reinstate a share buyback program later in 2025.
Operating results
Mine-by-mine summaries for 2024 fourth-quarter and full-year operating results may be found on pages 19 and 23 of this news release. Highlights include the following:
Tasiast had another excellent year in 2024, achieving record annual production and cash flow. The record annual production was mainly a result of record throughput following the completion of the Tasiast 24k project in the second half of 2023. Quarter-over-quarter, production was lower as a result of planned lower grades and mill maintenance, partially offset by improvements in recovery.
Tasiast’s full-year cost of sales per ounce sold was higher year-over-year primarily due to higher royalties as a result of the increase in gold prices and higher labour costs, largely offset by a higher proportion of costs allocated to capital development. Cost of sales per ounce sold increased quarter-over-quarter, mainly due to the decrease in production.
At Paracatu, full-year production decreased compared with 2023, mainly as a result of lower grades due to planned mine sequencing into harder material in the southwest area of the pit. Cost of sales per ounce sold was higher year-over-year due to lower production, higher drilling contractor and blasting supply costs, partially offset by favourable foreign exchange rates. Production decreased quarter-over-quarter mainly due to the lower throughput from the timing of mill maintenance and mine sequencing. Cost of sales per ounce sold was higher quarter-over-quarter due to the decrease in production, partially offset by favorable foreign exchange rates. In 2025, annual production is expected to increase as the site moves into higher-grade portions of the mine plan.
At La Coipa, full year production decreased compared with 2023 due to a decrease in silver grades and throughput, partially offset by an increase in gold grades. Production increased quarter-over-quarter due to higher throughput. Cost of sales per ounce sold was higher in both comparable periods primarily due to a lower proportion of mining activities related to capital development in 2024 and higher mill maintenance costs and optimization, partially offset by favourable foreign exchange rates. Kinross continues to progress permitting work for mine life extensions at La Coipa.
Full-year production at Fort Knox increased significantly compared with 2023, primarily due to first production from the higher-grade, higher-recovery ore from Manh Choh in the second half of 2024. Cost of sales per ounce sold was in line with 2023. Quarter-over-quarter production decreased and cost of sales per ounce sold increased due to the timing of processing Manh Choh ore, which was more heavily weighted to Q3 2024.
At Round Mountain, full-year production decreased compared with 2023 due to fewer ounces recovered from the heap leach pads, partially offset by higher mill production. Cost of sales per ounce sold was in line with 2023. Quarter-over-quarter, production was in line and cost of sales per ounce sold increased largely due to higher cost ounces produced from the heap leach pads.
At Bald Mountain, full-year production increased compared with 2023 due to higher grades. Full-year cost of sales per ounce sold decreased mainly due to lower supplies costs and higher production, partially offset by a lower proportion of mining activities related to capital development. Quarter-over-quarter, production was largely in line and cost of sales per ounce sold was lower mainly due to the timing of sales.
Development projects
Great Bear
At Great Bear, Kinross continues to progress its AEX program and Main Project permitting.
For the AEX program, early works, including tree clearing and earthworks, has commenced with the necessary permits received for all current activities. The two remaining permits required for full AEX completion and operation are under review by the regulatory authorities and are expected to be received later in the year, when they are required. Detailed engineering and procurement continue to advance.
The Company is focused on progressing AEX activities including construction of the exploration decline planned to commence in late 2025.
For the Main Project, Kinross is advancing detailed engineering and execution planning. The selection of design partners is well underway and work is planned to commence in Q1 2025. This work will provide key engineering information for permitting and construction.
The Company continues to work with the Impact Assessment Agency of Canada on advancing its Impact Statement, which is planned to be submitted later in 2025. Consultation continues with designated Indigenous communities, including discussions to finalize related agreements.
In 2025, Kinross has shifted from deep underground resource drilling to regional exploration work with the goal of identifying new open pit and underground deposits.
Kinross released its Preliminary Economic Assessment for Great Bear on September 10, 2024. The Project is expected to produce over 500,000 ounces per year at an all-in sustaining cost of approximately $800 per ounce during the first 8 years through a conventional, modest capital 10,000 tonne per day mill. In parallel, Kinross also released an updated mineral resource estimate increasing the inferred resource estimate by 568 koz. to 3.9 Moz. which was in addition to the M&I resource estimate of 2.7 Moz.
Bald Mountain Redbird
Kinross is pleased to announce plans to proceed with mining at the Redbird pit at Bald Mountain, which contains approximately 1 million oz. of gold reserve, following the receipt of the Juniper permit in the second half of 2024.
Kinross has approved mining of Phase 1 at Redbird, which contains 270 koz. and is expected to produce approximately 175 koz., extending production into 2028. Phase 2, unlocking another 680 koz. contained, could begin in 2026 and extend production from Bald Mountain through 2031.
Phase 1 lowers the initial capital risk by leveraging existing heap leach infrastructure, pulls forward production into 2027, and can progress in 2025 while work continues on optimizing the design and execution plan for Phase 2.
Phase 1 initial capex of $120 million is primarily pre-strip mining cost, and the project has an all-in sustaining cost of approximately $1,500/oz.
Lobo-Marte
Kinross is progressing baseline studies to support the Environmental Impact Assessment (EIA) for the Lobo-Marte project. Lobo-Marte continues to be a potential large, low-cost mine and Kinross is committed to progressing next steps to advance the project.
Company Guidance
The following section of the news release represents forward-looking information and users are cautioned that actual results may vary. We refer to the risks and assumptions contained in the Cautionary Statement on Forward-Looking Information on pages 41 and 42 of this news release.
This Company Guidance section below references attributable production cost of sales per equivalent ounce, attributable all-in sustaining cost per equivalent ounce sold, and sustaining, non-sustaining and attributable capital expenditures, which are non-GAAP ratios and financial measures, as applicable, with no standardized meaning under IFRS and therefore, may not be comparable to similar measures presented by other issuers. The definitions of these non-GAAP ratios and financial measures and comparable reconciliations are included on pages 25 to 31 of this news release.
Attributable1 production guidance
In 2025, Kinross expects to produce 2.0 million attributable Au eq. oz.12 (+/- 5%) from its operations. Production is expected to remain stable at 2.0 million attributable Au eq. oz.12 (+/- 5%) for each of 2026 and 2027. In 2024, Kinross produced 2.13 Au eq. oz.
|
Annual attributable1 gold equivalent production guidance (+/- 5%) | |
| 2025 | 2.0 million oz. |
| 2026 | 2.0 million oz. |
| 2027 | 2.0 million oz. |
________________________
12 Attributable gold equivalent ounce production guidance for 2025 includes approximately 4.3 million ounces of silver.
Attributable1 cost guidance
Attributable production cost of sales is expected to be $1,120 per Au eq. oz.1 (+/- 5%) for 2025. In 2024, production cost of sales2 and attributable production cost of sales1 were $1,020 per Au eq. oz. and $1,021 per Au eq. oz., respectively. The moderate year-over-year increase in 2025 is mainly due to lower overall production with a change in sales mix, including lower production at Tasiast, and inflationary impacts.
The Company expects its attributable all-in sustaining cost1 to be $1,500 per Au eq. oz. (+/- 5%) for 2025. In 2024, attributable all-in sustaining cost1 was $1,388 per Au eq. oz. sold. The expected increase in 2025 is largely a result of the increase in attributable production cost of sales.
2025 attributable1 production and cost guidance
|
Q4 2024 results |
2024 full-year results |
2025 guidance (+/- 5%) |
|||
| Gold equivalent basis | |||||
| Production (Au eq. oz.) | 501,209 | 2.13 million | 2.0 million11 | ||
| Attributable production cost of sales per Au eq. oz. sold1 | $1,096 | $1,021 | $1,120 | ||
| Production cost of sales per Au eq. oz. sold2 | $1,098 | $1,020 | |||
| Attributable all-in sustaining cost per Au eq. oz. sold1 | $1,510 | $1,388 | $1,500 | ||
2025 attributable1 production and cost guidance by country
| Country |
2025 attributable production guidance (Au eq. oz.)1, 12 (+/-5%) |
Percentage of total forecast production13 |
2025 attributable production cost of sales guidance (per Au eq. oz. sold)1,12 (+/-5%) |
2024 production cost of sales (per Au eq. oz. sold)2 |
2024 attributable production cost of sales (per Au eq. oz. sold)2 |
||||
| Mauritania | 500,000 | 25% | $860 | $681 | $681 | ||||
| Brazil | 585,000 | 29% | $1,025 | $1,039 | $1,039 | ||||
| Chile | 230,000 | 12% | $1,060 | $959 | $959 | ||||
| United States | 685,000 | 34% | $1,420 | $1,295 | $1,313 | ||||
| TOTAL | 2.0 million | 100% | $1,120 | $1,020 | $1,021 |
Material assumptions used to forecast 2025 guidance, most notably relating to production cost of sales, are as follows:
- a gold price of $2,500 per ounce;
- a silver price of $30 per ounce;
- an oil price of $80 per barrel;
- foreign exchange rates of:
- 5.25 Brazilian reais to the U.S. dollar;
- 900 Chilean pesos to the U.S. dollar;
- 37.50 Mauritanian ouguiyas to the U.S. dollar; and
- 1.35 Canadian dollars to the U.S. dollar;
Taking into account existing currency and oil hedges:
- a 10% change in foreign currency exchange rates14 would be expected to result in an approximate $25 impact on attributable production cost of sales per equivalent ounce sold1;
- specific to the Brazilian real, a 10% change in this exchange rate would be expected to result in an approximate $45 impact on Brazilian attributable production cost of sales per equivalent ounce sold1;
- specific to the Chilean peso, a 10% change in this exchange rate would be expected to result in an approximate $50 impact on Chilean attributable production cost of sales per equivalent ounce sold1;
- a $10 per barrel change in the price of oil would be expected to result in an approximate $3 impact on fuel consumption costs on attributable production cost of sales per equivalent ounce sold1; and
- a $100 change in the price of gold would be expected to result in an approximate $5 impact on attributable production cost of sales per equivalent ounce sold1 as a result of a change in royalties.
________________________
13 The percentages are calculated based on the mid-point of country 2025 forecast production.
14 Refers to all of the currencies in the countries where the Company has mining operations, fluctuating simultaneously by 10% in the same direction, either appreciating or depreciating, taking into consideration the impact of hedging and the weighting of each currency within our consolidated cost structure.
Attributable capital expenditures15 guidance
Attributable capital expenditures for 2025 are forecast to be approximately $1,150 million (+/- 5%) and are summarized in the table below. In 2024, capital expenditures3 and attributable capital expenditures were $1,076 million and $1,051 million, respectively.
Kinross’ attributable capital expenditures outlook for 2026 and 2027 is approximately expected to be in line with 2025, subject to ongoing inflationary impacts.
|
Country |
Forecast 2025 sustaining capital15 (+/-5%) (attributable) (million) |
Forecast 2025 non-sustaining capital15 (+/-5%) (attributable) (million) |
Total 2025 forecast capital15 (+/-5%) (attributable) (million) |
2024 sustaining capital15 (million) |
2024 non-sustaining capital15 (million) |
2024 total capital15 (consolidated) (million) |
2024 total capital15 (attributable) (million) |
||||||
| Mauritania | $105 | $255 | $360 | $64 | $280 | $344 | $344 | ||||||
| Brazil | $195 | $0 | $195 | $141 | $0 | $141 | $141 | ||||||
| Chile | $50 | $10 | $60 | $66 | $15 | $81 | $81 | ||||||
| U.S. | $185 | $200 | $385 | $257 | $211 | $468 | $443 | ||||||
|
Canada and other |
$0 | $150 | $150 | $(1) | $43 | $42 | $42 | ||||||
| TOTAL | $535 | $615 | $1,150 | $527 | $549 | $1,076 | $1,051 |
2025 sustaining capital15 includes the following forecast spending estimates:
| • | Mine development: | $55 million (United States), $10 million (Chile), $20 million (Mauritania) | |
| • | Mobile equipment: | $65 million (United States), $90 million (Brazil), $5 million (Chile), $35 million (Mauritania) | |
| • | Mill facilities: | $5 million (United States), $25 million (Brazil), $20 million (Chile), $10 million (Mauritania) | |
| • |
Leach facilities: | $25 million (United States), $5 million (Chile) | |
| • | Tailings facilities: | $5 million (United States), $75 million (Brazil), $5 million (Chile), $10 million (Mauritania) | |
2025 non-sustaining capital15 includes the following forecast spending estimates:
| • | Tasiast West Branch stripping: | $255 million | |
| • | Great Bear AEX construction, detailed engineering and other: | $150 million | |
| • | Bald Mountain Redbird 1: | $75 million | |
| • | Round Mountain Phase S: | $75 million |
________________________
15 Forecast 2025 sustaining, non-sustaining and total forecast capital expenditures are on an attributable basis and include Kinross’ share of Manh Choh (70%) capital expenditures. Actual results as reported for the year ended December 31, 2024, for sustaining, non-sustaining and total capital expenditures (refer to footnote 3) are on a total basis and include 100% of Manh Choh capital expenditures. Sustaining, non-sustaining and attributable capital expenditures are non-GAAP financial measures (refer to footnote 7) and are defined and reconciled on pages 30 and 31 of this news release.
Other 2025 guidance
| Category | 2025 Guidance | Summary | |||
| Exploration and Business Development ($M) | $200 (+/- 5%) | 2025 guidance includes approximately $175 million of exploration spend on brownfields, minex and greenfields exploration targets (2024 – $166.4 million). For details about the 2025 exploration program, see page 11. |
|||
| General and Administrative ($M) | $125 (+/- 5%) | In line with 2024 results. | |||
| Other Operating Costs ($M) | $125-$150 | Primarily relates to studies and permitting activities that do not meet the criteria for capitalization, as well as care and maintenance and reclamation activities at non-operating sites. | |||
| Effective Tax Rate (ETR)16 | 32% - 37% | ETR based on adjusted net earnings. | |||
| Taxes paid (cash) ($M) | $330 | Taxes paid is expected to increase by approximately $4 million for every $100/oz movement in the realized gold price. | |||
| DD&A ($/oz.)17 | $540 (+/- 5%) | In line with 2024 results. | |||
| Interest paid ($M) (incl. capitalized interest) | $75 | Includes approximately $20 million of capitalized interest and $55 million of interest expense. Interest expense excludes accretion of the Company’s reclamation and remediation obligations, as well as lease liabilities, which for 2024 totaled $42.3 million. (2024 – Total interest paid of $128.2 million, of which $92.6 million was capitalized. The 2025 decrease is due to the full repayment of the term loan on February 10th, 2025.) |
________________________
16 The forecast ETR range for 2025 assumes gold price, foreign exchange and tax rates in the jurisdictions in which the Company operates remain stable and within 2025 guidance assumptions. The ETR does not include the impact of items which the Company believes are not reflective of the Company’s underlying performance, such as the impact of net foreign currency translations on tax deductions and taxes related to prior periods. Management believes that the ETR range provides investors with the ability to better evaluate the Company’s underlying performance. However, the ETR range is not necessarily an indicator of tax expense recognized under IFRS. The rate is sensitive to the relative proportion of sales between the Company’s various tax jurisdictions and realized gold prices.
17 DD&A ($/oz) is defined as depreciation, depletion and amortization, as reported on the consolidated statements of operations, divided by total gold equivalent ounces sold.
Sustainability
Kinross continued to deliver strong sustainability performance throughout the year, reflected in strong Sustainability scores as measured by MSCI, LSEG, Moody’s, and Sustainalytics, and was named to the S&P 2025 Global Sustainability Yearbook for the 12th time since 2012.
Kinross’ robust approach to environmental performance includes advancing its climate change strategy. The Company is on track to achieve its greenhouse gas (GHG) target of reducing emissions intensity by 30% by 2030 from its 2021 baseline. In 2024, Kinross implemented more than 15 energy efficiency projects across sites, including haul route optimization, switching from diesel generators to electricity at fuel islands and lime silos, incorporation of electric buses, and other energy efficiency initiatives. The Company also advanced its estimation of Scope 3 GHG emissions and completed outreach with the suppliers representing the majority of total spend to understand their approaches to emissions reduction.
Kinross engages directly with local communities around its operations to understand their economic, social and development goals, working together to ensure that meaningful, long-term benefits are realized through job creation, training programs, procurement, tax payments, and targeted community programs. Flood relief aid was provided to communities in the south of both Mauritania and Brazil, including essential food supplies and emergency shelter. Paracatu worked with the World Gold Council to publish a video demonstrating the positive impact of community partnerships to support programs and projects that enhance the well-being of local people, with a particular focus on sustainability after mine closure. Kinross was also recognized with a 2024 award for Business Achievement in Sustainability by the Canadian Council for the Americas.
Kinross’ robust corporate governance standards for its Board of Directors continue to be driven by a focus on delivering value through a mix of skills and experience, diversity, director independence and succession planning. Kinross was the top scoring gold mining company in The Globe and Mail’s annual corporate governance ranking and increased its score by four points from 2023, ranking in the top 10% of companies overall.
Exploration update
In 2024, approximately 318,000 metres of drilling was completed for all exploration projects (brownfields, minex and greenfields).
Brownfields and minex exploration
The Company’s brownfields and minex exploration efforts – which accounted for approximately 85% of the Company’s exploration – continued to focus within the footprint of existing mines and projects during 2024.
Great Bear
Kinross’ exploration efforts at Great Bear in 2024 primarily focused on directional drilling beyond the 1,000-metre depth to show the underground potential of the asset, resulting in the addition of 568 koz. to the inferred resource, which was updated in September along with the release of a PEA.
The 2024 drilling intersected mineralization beyond the current resource and PEA inventory across multiple zones up to a vertical depth of 1,600 metres, demonstrating the system is still open with continuation of high-grade mineralization at depth and highlighting the potential for further resource additions.
Given the costs of drilling to this depth from surface and the significant resource already identified, late last year the exploration focus shifted to regional exploration work on the ~120 square kilometre land package to look for additional open pit and underground opportunities. In parallel, work on the AEX decline will be progressed to support future exploration at LP from underground.
Round Mountain
At Phase X, drilling in Q4 expanded infill drilling into the upper zone of the primary exploration target, with results showing numerous intercepts with strong widths and grades, supporting the thesis of potential for bulk mining at Phase X. Approximately 21,000 metres have been drilled at Phase X since starting the exploration decline in 2023. The program in 2024 successfully intersected both the upper and lower exploration targets, demonstrating continuous wide mineralization with strong grades, confirming our exploration thesis. Highlights from 2024 drilling include:
- RX-0050 – 109m @ 3.1 g/t Au
- Including 6m @ 21.5 g/t Au
- RX-0051 – 110m @5.0 g/t Au
- Including 3m @ 65.6 g/t Au
- RX-0052 – 136m @ 8.7 g/t Au
- Including 8m @ 85.2 g/t Au
- RX-0053 – 131m @ 5.2 g/t Au
- Including 2m @ 215.4 g/t Au
- RX-0054 – 67m @ 3.4 g/t Au
- Including 20m @ 6.6 g/t Au
- RX-0055 – 139m @ 4.1 g/t Au
- Including 8m @ 20.5 g/t Au
- RX-0056 – 44m @ 3.3 g/t Au
- Including 5m @ 12.1 g/t Au
- RX-0057 – 79m @ 2.2 g/t Au
- Including 2m @ 10.1 g/t Au
- RX-0058 – 58m @ 4.4 g/t Au
- Including 11m @ 13.7 g/t Au
- RX-0059 – 99m @ 6.1 g/t Au
- Including 12m @ 29.5 g/t Au
- RX-0060 – 116m @ 3.4 g/t Au
- Including 5m @ 19.3 g/t Au
- RX-0061 – 34m @ 2.6 g/t Au
- Including 3m @ 7.6 g/t Au
- RX-0062 – 41m @ 3.2 g/t Au
- Including 5m @ 9.3 g/t Au
- RX-0063 – 104m @ 3.5 g/t Au
- Including 3m @ 67.6 g/t Au
In 2025 Kinross will focus on completing infill drilling of the exploration target at Phase X to support further studies to progress the project.
At Gold Hill, approximately 5,000 metres of drilling were completed both from the bottom of the pit to better define the vein system and from surface, which extended one of the main targets 150 metres on strike.
Curlew Basin
The 30,400 metre 2024 drilling program at Curlew Basin successfully targeted higher grade extensions of mineralization and delivered the following successes:
- Inferred resource addition of 125 koz with a strong average grade of 9.0 g/t Au at the North Stealth Zone, which remains open on strike and dip.
- Intersected further high-grade mineralization at the Roadrunner vein system (reported in Q3 2023 14.2m @ 16.5 g/t Au, includes 7.3m @ 25.3 g/t Au).
- Confirmed extensions and continuity in several other vein zones with multiple wide, high-grade intercepts. Highlights include:
- WZ-1456 – 2.3m @ 448.9 g/t Au, including 1.0m @ 1045.4 g/t Au
- K5-1469 – 4.9m @15.2 g/t Au, including 2.3m @ 22.78 g/t Au
- ST-1211 – 8.5m @ 7.9 g/t Au, including 1.4m @ 12.68 g/t Au
In 2025, Kinross plans to continue this focus on higher-grade mineralization, targeting new discoveries and extensions of mineralization at North Stealth and Roadrunner.
Alaska
Drilling this year at Fort Knox focused on growth at two main targets: around the satellite Gil pit and around the Fort Knox pit. The growth highlights at Fort Knox have not been included in the current resource update and may offer potential to augment medium-term production plans at Fort Knox.
Gil highlights include:
- GC24-872 – 9.9m @ 1.5 g/t Au
- GC24-874 – 10.1m @ 3.4 g/t Au, including 2.0m @ 6.4 g/t Au
- GC24-876 – 9.4m @ 7.1 g/t Au, including 1.8m @ 23.8 g/t Au
- GC24-877 – 6.2m @ 6.2 g/t Au, including 1.4m @ 24.6 g/t Au
Fort Knox highlights include:
- FFC24-1912 – 2.3m @ 2.9 g/t Au
- FFC24-1913 – 3.3m @ 5.0 g/t Au
- FFC24-1916 – 15.4m @ 0.9 g/t Au
An additional 2,466 metres of drilling occurred on the Fort Knox property, testing new target areas between the Fort Knox and Gil mines.
In 2025, drilling at Fort Knox will continue to focus on growth opportunities at Gil and around the Fort Knox pit, and will also target exploration along the structural trend between the Fort Knox and Gil deposits.
At Manh Choh, 4,760 metres of drilling was completed across six target areas identifying encouraging skarn alteration at three targets that will be followed up on in 2025. Surface sampling to identify new drill targets was completed along the mine road corridor and greater Tetlin lease in 2024.
Bald Mountain
Exploration drilling at Bald Mountain in 2024 focused on low-strip, near-pit extensions in the North and South area of operations and within the Bida trend, with roughly 21,000 metres drilled in the year on brownfields and minex programs.
2025 drilling will be focused on conversion of inferred resources at the Redbird pit and on generative projects looking for new deposits on the large, highly prospective land package at Bald Mountain.
Tasiast
At Tasiast, drill testing of the West Branch orebody at depth, to provide additional data for assessing future underground mining, commenced in the second half of the year. Wide zones of mineralization have been intersected down plunge of the current underground resource of 1.1 Moz. at 2.52 g/t, extending mineralization on strike and down plunge 700 metres to date.
At Fennec, which is a satellite deposit on the TMLSA license, work completed during the year resulted in the addition of 110 koz. to reserve.
On the SENISA licenses, two RC and two diamond drill rigs were actively drilling target areas. A total of 51,135 metres had been drilled by year end and drilling will continue throughout 2025.
Chile
The brownfields drilling program further delineated the gold porphyry mineralization potential at Cerros Bravos. The porphyry is located approximately 8 kilometres due north of Kinross’ mine facilities. Step out drilling and geophysics carried out in 2024 helped define new targets for further work in 2025 at Cerros Bravos.
2025 drilling in Chile will also focus on existing known trends on the La Coipa license looking for extensions of previously mined orebodies and for new mineralization.
Brazil
Brownfields exploration focused on systematically testing targets on the Company’s extensive land packages, which extend over 35 kilometres along the northwest corridor from the Paracatu mine, with results showing similar style and grade of mineralization to Paracatu. Along the south corridor from Paracatu, reconnaissance mapping, soil sampling, and ground IP and Lidar surveys were also completed in 2024, generating additional targets, which will be drill tested in 2025.
Greenfields exploration update
The greenfields exploration strategy is to identify and explore in areas that have the potential to host high-grade gold deposits. The Company looks for opportunities where it can stake its own claims or collaborate with high-quality junior exploration companies through either joint venture agreements or via equity investment. The primary focus is exploring for orogenic, epithermal, Carlin and intrusion related gold and gold-copper style deposits.
The greenfields exploration programs in 2024 were focused on targets located in Canada, the U.S.A. and Finland with approximately 45,000 metres of drilling completed on all projects.
Canada
Outside of Great Bear, the focus in Canada was primarily on the large land holdings in Snow Lake, Manitoba, where Kinross has 100% ownership of six exploration properties: Laguna, Laguna North, Puella Bay, Lucky Jack, DSN and SLG.
Drilling on the Laguna and the Laguna North properties has continued to define and extend high-grade mineralization on multiple gold rich, shear hosted vein systems. Kinross is focused on expanding identified veins and discovering additional vein systems on the property to increase the critical mass of mineralization to support further work.
Kinross is also progressing prospecting and mapping on the SLG property to find new veins after identifying a 200 metres long shear zone in 2023. The 2024 work identified two new shear zones 1.5 kilometres and 4 kilometres from the 2023 shear zone, with grab samples on the new zones showing strong grades including 78.9 g/t, 38.2 g/t, 30.8 g/t, 23.9 g/t, 14.2 g/t,13.75 g/t, 13.25 g/t, and 12.25 g/t within quartz veins.
Outside of Manitoba, Kinross has 100% ownership of four greenfield exploration properties in northwest Ontario, three of which are in the Red Lake district outside of the Great Bear property. Initial reconnaissance mapping and prospecting on one of those properties yielded grab samples of 12.35 g/t, 2.3 g/t, 3.55 g/t, 3.17 g/t and 5.16 g/t Au in newly identified quartz veins. Kinross plans to follow-up with detailed mapping and prospecting in 2025.
In October 2024, an option agreement was signed with Puma Exploration Inc. for a 65% interest in their Williams Brook property in New Brunswick. The Williams Brook project has seen early-stage work completed by Puma which has identified 5 anomalous zones including Lynx, Tiger, Cheetah, Jaguar, and Cougar. Highlights from each target include 5.55 g/t Au over 50.15m at Lynx and grab samples of values up to up to 34 g/t Au at Jaguar, 60.10 g/t Au at Cougar, 6.69 g/t Au at Cheetah and 19.9 g/t Au at Tiger.
U.S.A.
Kinross holds a number of projects in Nevada that are either 100% owned or are in joint venture with private individuals, or state agencies. Work on Kinross’ Nevada projects in 2024 included geophysics, prospecting, mapping, and RC and diamond drilling of early-stage targets.
In March 2024, a joint venture was established with Riley Gold Corporation on its PWC project, which is contiguous with the western boundary of Nevada Gold Mines’ Pipeline Complex. In September 2024, Kinross completed an initial diamond drill hole, designed to test for favourable lower plate carbonate Carlin-type host rocks. The initial 1,095 metre drill hole successfully intercepted the favourable lower plate carbonates starting at a depth of 715 metres, demonstrating that known Cortez District host lithologies exist at explorable drill depths over a large, untested area. Further drilling will begin in Q2 2025.
Work continues evaluating and advancing new pipeline projects through third party agreements and on opportunistic claim staking and drill testing of opportunities in the principal metallogenic belts throughout the U.S. Great Basin, including the Walker Lane and the primary trends of Carlin-type deposits.
Finland
Kinross is progressing exploration on its own land positions and with joint venture partners in Finland on the Central Lapland Greenstone Belt, along a greenstone belt of similar scale to the Abitibi that has had limited historical gold exploration and development. Kinross’ land positions are proximal to Agnico Eagle’s Kittilä Gold mine and Rupert Resource’s Ikkari gold deposit, which reported more than 4 million ounces at 2.2 g/t Au in indicated resources.
Work in 2024 included approximately 11,000 meters of base-of-till drilling which is used to test the surface of bedrock under cover for gold anomalies. Base-of-till drilling was used successfully in the discoveries of Rupert Resource’s Ikkari gold deposit and Agnico Eagle’s Kittilä gold mine, and the work on Kinross’ properties in 2024 identified numerous gold anomalies.
Kinross also completed approximately 4,800 metres of diamond drilling to follow up on identified gold anomalies in 2024, with results showing encouraging gold grades at Launi-East including 5.23 g/t over 3.65m and 10.05 g/t over 0.95m. Kinross will continue to follow up on identified targets in 2025.
2025 Focus
2025 exploration expenditure guidance (brownfields, minex and greenfields) is $175 million (+/-5%) compared with the $166.4 million spent in 2024. The 2025 programs are designed to follow-up on existing zones of mineralization and to make new discoveries in all of Kinross’ jurisdictions.
Priority exploration projects:
- At Great Bear, focused on the discovery of new open pit and underground targets outside of the LP, Hinge and Limb areas on Kinross’ 120 square kilometre land package
- At Curlew, delineate and extend zones of high-grade mineralization at North Stealth and Roadrunner
- At Round Mountain, complete initial infill drilling of the Phase X exploration target
- At Tasiast, underground potential focused drilling from surface at West Branch, Prolongation and Piment, as well as continued exploration of the SENISA land package and on satellite deposits on the TMLSA land package
- In Chile, drill test a number of greenfields and brownfields, targeting both porphyry and high sulphidation epithermal styles of mineralization as well as extension of known oxide deposits
- At Paracatu, test targets along the mine trend
- In Canada, continue to explore on the large Snow Lake, Manitoba land package
Appendix A: Refer to page 39 of this news release for supplementary illustrations.
Full drill results are available here: https://www.kinross.com/Exploration-Drill-Results-Appendix-A-Q4-YE-2024
2024 Mineral Reserves and Mineral Resources update
(See the Company’s detailed Annual Mineral Reserve and Mineral Resource Statement estimated as at December 31, 2024 and explanatory notes starting at page 33.)
Kinross increased its gold price assumptions from $1,400 per ounce to $1,600 per ounce for its mineral reserve estimates and from $1,700 per ounce to $2,000 per ounce for its mineral resource estimates, as of December 31, 202418.
The Company also increased its silver price assumptions to $20 per ounce and $25 per ounce for its mineral reserve and mineral resource estimates, respectively.
Kinross continues to prioritize quality, high-margin, low-cost ounces in its portfolio, and maintained its fully loaded costing methodology.
Kinross is focused on upgrading the quality of its resources through delineating high-grade gold ounces with the objective of converting to reserves. In 2024, Kinross added 1.7 million ounces to its inferred resource, which included high-grade additions at both Great Bear and Curlew.
| Kinross Gold Mineral Reserve and Mineral Resource estimates19 | |||||
|
2023 (Au koz.) |
Depletion (Au koz.) |
Geology & Engineering (Au koz.) |
2024 (Au koz.) |
||
| Proven and Probable Reserves | 22,757 | (2,360) | 1,461 | 21,857 | |
| Measured and Indicated Resources | 25,968 | 11820 | (220) | 25,867 | |
| Inferred Resources | 11,484 | (25) | 1,734 | 13,193 | |
________________________
18 Please see pages 36 and 37 for Mineral Reserve and Mineral Resource Statement Notes.
19 Rounding of values to the 000s may result in apparent discrepancies.
20 M&I depletion is positive due to the addition of 221 koz. stockpile to resource at Tasiast in 2024.
Proven and Probable Mineral Reserves
Kinross’ total proven and probable mineral reserve estimates decreased by 4%, or 0.9 million Au oz., to 21.9 million Au oz. at year-end 2024 compared with 22.8 million Au oz. at year-end 2023. The net decrease was mostly due to depletion, with decreases offset by a net increase of 1.5 million ounces driven by increases at Bald Mountain, Tasiast, and Paracatu.
Bald Mountain reserves increased by 971 koz. before depletion driven by conversion of resources to reserves at Redbird after receiving permits for the Juniper land package.
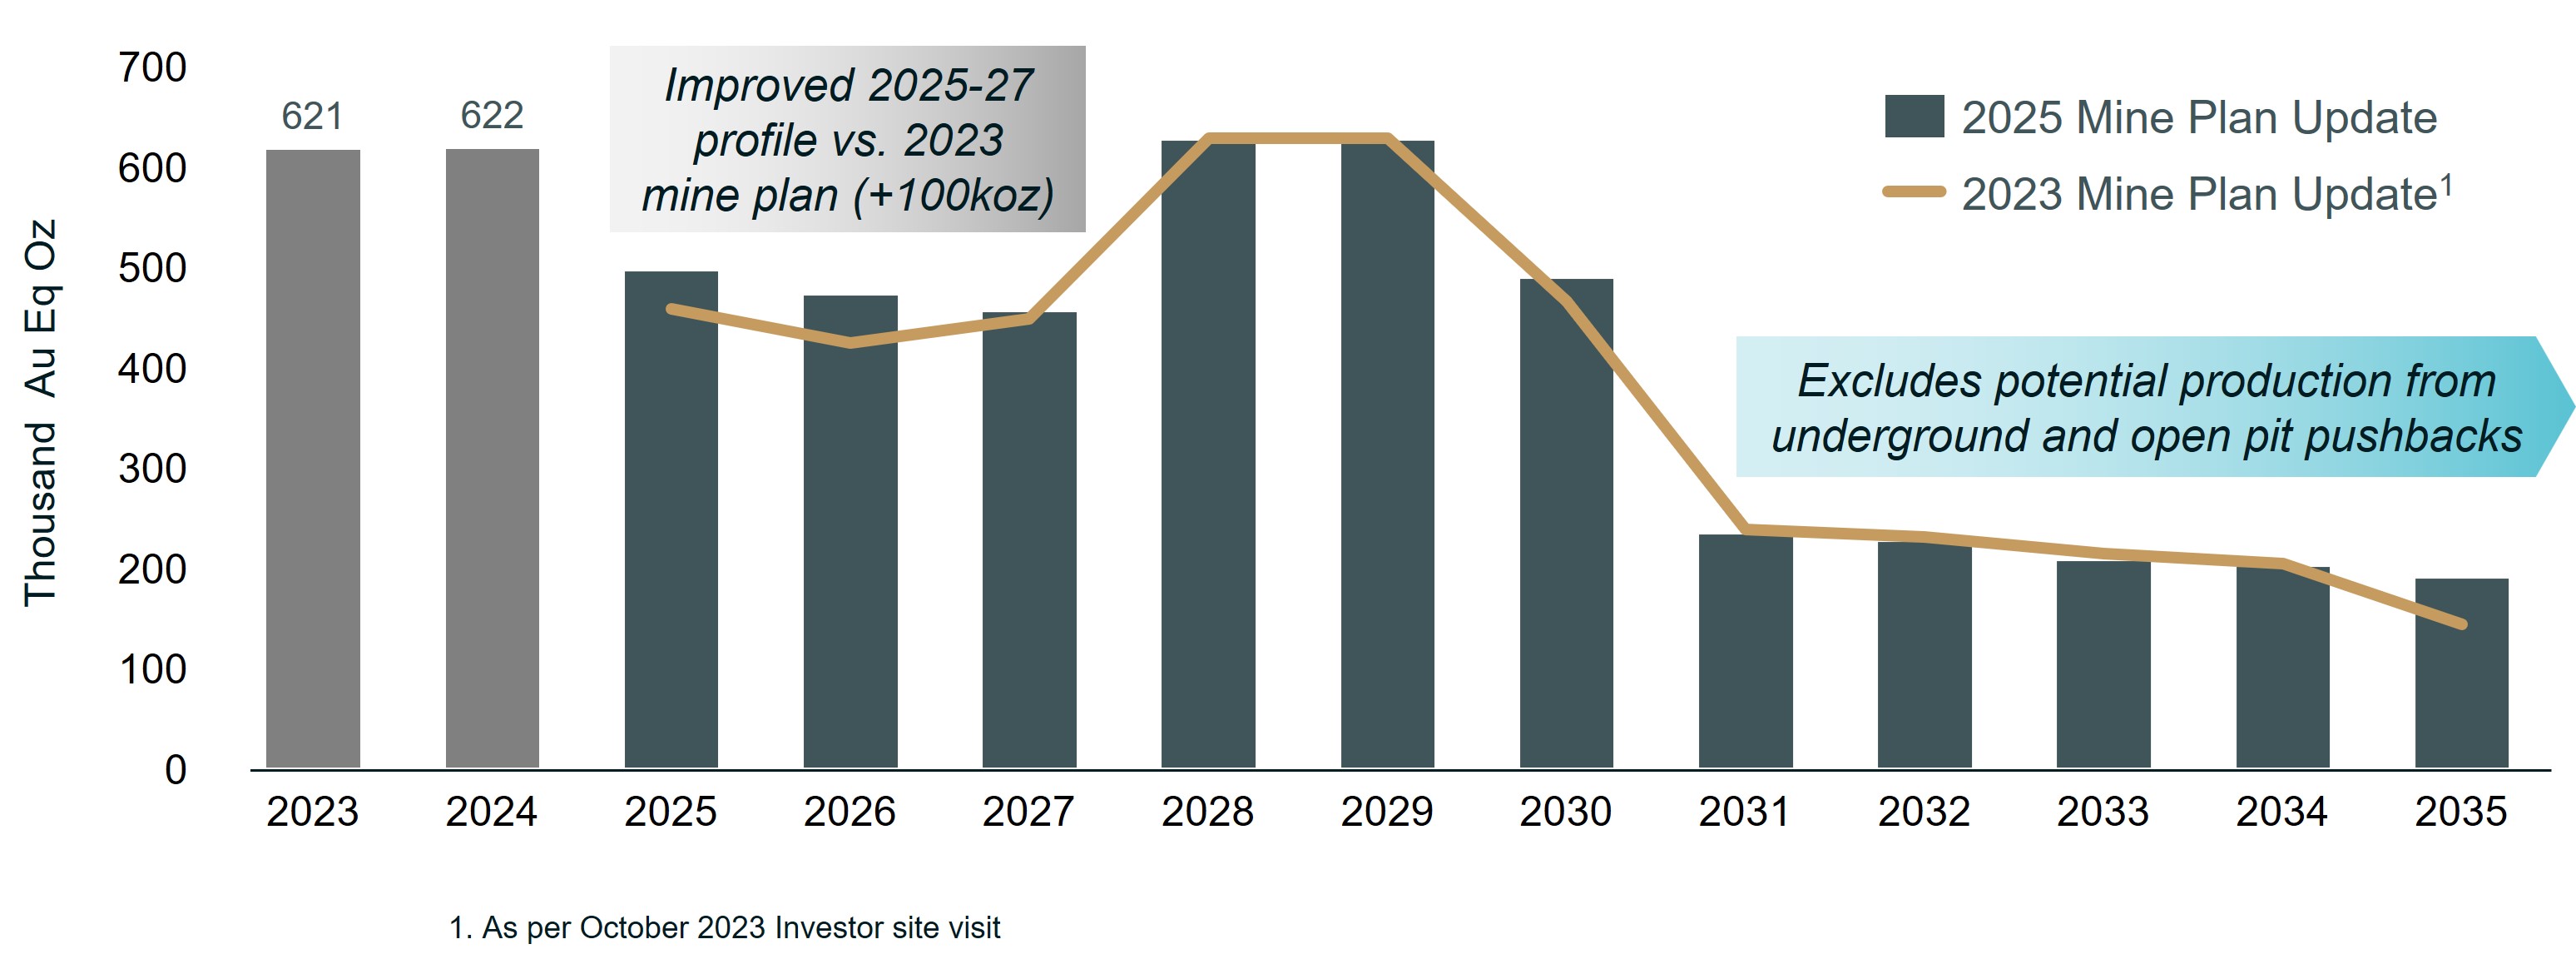
At Tasiast, a new life of mine plan has been completed following the 2024 reserve update. Production from Tasiast from 2025 through 2027 is decreasing compared to 2024 driven by mine plan sequencing and lower grades during the stripping phase of West Branch 5. The new life of mine plan has shown an increase of 100 koz. over that 3-year period as compared to the previous life of mine plan on the back of operational improvements, design optimizations, and the addition of the Fennec satellite pit.
The following graph illustrates Tasiast’s reserve and mine plan update:
Measured and Indicated Mineral Resources
Kinross’ total measured and indicated mineral resource estimate at year-end 2024 was 25.9 million Au oz. compared with 26.0 million Au oz. at year-end 2023. The slight decrease is the result of net growth on the higher gold price and new drilling less the conversion of resources to reserves.
Inferred Mineral Resources
Kinross’ total inferred mineral resource estimate increased by 15% or 1.7 million Au oz. to 13.2 million Au oz. at year-end 2024, compared with 11.5 million Au oz. at year-end 2023. The increase in net growth, with additions from most sites across the portfolio, was driven by new drilling at Great Bear and Curlew and growth on higher gold price.
Board update
As previously disclosed, Catherine McLeod-Seltzer, an independent Board member since 2005 and Chair of the Board since 2019, has announced that she will not be standing for election at the Company’s annual meeting of shareholders in May 2025. Following a robust succession process, Kelly Osborne has been approved as Chair of the Board, effective upon his re-election as an independent director at the Company’s annual meeting of shareholders on May 7, 2025.
Ms. McLeod-Seltzer has made numerous and significant contributions during her 20-year directorship at the Company. She has overseen the dramatic reshaping of Kinross’ portfolio as the Company exited and entered new operating jurisdictions, acquired the Great Bear development project, and lead the strong focus on debt reduction and returning capital to shareholders. During her tenure, she championed diversity at all levels of the organization, including at the Board level and Senior Leadership Team, drove a results-based focus on Sustainability performance, and also oversaw a number of key governance initiatives including an effective Board succession program that has added six new Directors during her tenure as Chair.
Ms. McLeod-Seltzer’s extensive leadership, having been a founder, Board member and Chief Executive Officer in numerous mineral companies, has been recognized with several awards: She was named “Mining Man of the Year” by The Northern Miner in 1999; given the “Award for Performance” in 1997 and the Peak Award for Significant Board Contribution in 2021 by the Association of Women in Finance; named on the Financial Post’s “Power 50”; has received the “Canada’s Most Powerful Women Top 100 Award”; and was named one of “100 Global Inspirational Women in Mining” in 2013 and 2016 by Women In Mining (UK).
Mr. Osborne, an independent Director of Kinross since 2015, has served on the Corporate Governance and Nominating Committee and Corporate Responsibility and Technical Committee during his tenure, and served as Chair of the Corporate Responsibility and Technical Committee from 2018 until 2024. In addition, Mr. Osborne had an extensive career in the mining industry as an operator and senior executive, most recently serving as the CEO of a U.S.-based, wholly owned subsidiary of Antofagasta plc., until his retirement in June 2022.
“We are pleased that Kelly Osborne will take on the role of Independent Chair and look forward to his guidance and stewardship as we continue to deliver value for our shareholders,” said J. Paul Rollinson, CEO. “On behalf of the Board and Kinross management, I would like to extend a sincere thank you to Catherine for her leadership and dedication to the Company over the last 20 years. Catherine has been a central part of our culture and values, and the strong position Kinross is in today is largely due to her support as we advanced and executed on our strategic priorities."
The Board of Directors has appointed Dr. George Albino as a Director with an effective date of January 1, 2025. Dr. Albino is a geologist with over 45 years of experience in mining and finance, including 19 years as a sell-side mining analyst primarily focused on gold stocks. Dr. Albino was previously a Director with Eldorado Gold Corporation, including serving as Chair, and a Director with Orla Mining. He holds a Ph.D. in Economic Geology and Geochemistry from the University of Western Ontario, a M.Sc. in Economic Geology from Colorado State University, and a B.A.Sc. in Geological Engineering from Queen’s University.
Conference call details
In connection with this news release, Kinross will hold a conference call and audio webcast on Thursday, February 13, 2025, at 8 a.m. ET to discuss the results, followed by a question-and-answer session. To access the call, please dial:
Canada & US toll-free – +1 (888) 596-4144; Passcode: 8057299
Outside of Canada & US – +1 (646) 968-2525; Passcode: 8057299
Replay (available up to 14 days after the call):
Canada & US toll-free – +1 (800) 770-2030; Passcode: 8057299
Outside of Canada & US – +1 (647) 362-9199; Passcode: 8057299
You may also access the conference call on a listen-only basis via webcast at our website www.kinross.com. The audio webcast will be archived on www.kinross.com.
This release should be read in conjunction with Kinross’ 2024 year-end Financial Statements and Management’s Discussion and Analysis report at www.kinross.com. Kinross’ 2024 year-end Financial Statements and Management’s Discussion and Analysis have been filed with Canadian securities regulators (available at www.sedarplus.ca) and furnished with the U.S. Securities and Exchange Commission (available at www.sec.gov). Kinross shareholders may obtain a copy of the financial statements free of charge upon request to the Company.
About Kinross Gold Corporation
Kinross is a Canadian-based global senior gold mining company with operations and projects in the United States, Brazil, Mauritania, Chile and Canada. Our focus is on delivering value based on the core principles of responsible mining, operational excellence, disciplined growth, and balance sheet strength. Kinross maintains listings on the Toronto Stock Exchange (symbol: K) and the New York Stock Exchange (symbol: KGC).
Media Contact
Victoria Barrington
Senior Director, Corporate Communications
phone: 647-788-4153
victoria.barrington@kinross.com
Investor Relations Contact
David Shaver
Senior Vice-President, Investor Relations & Communications
phone: 416-365-2761
InvestorRelations@Kinross.com
Review of operations
| Three months ended December 31, | Gold equivalent ounces | ||||||||||||||
| Produced | Sold |
Production cost of sales ($millions) |
Production cost of sales/equivalent ounce sold |
||||||||||||
| 2024 | 2023 | 2024 | 2023 | 2024 | 2023 | 2024 | 2023 | ||||||||
| Tasiast | 139,411 | 160,764 | 144,041 | 171,199 | 104.4 | 110.4 | 725 | 645 | |||||||
| Paracatu | 123,899 | 127,940 | 124,690 | 132,886 | 131.6 | 144.2 | 1,055 | 1,085 | |||||||
| La Coipa | 58,533 | 73,823 | 57,852 | 73,477 | 68.2 | 52.9 | 1,179 | 720 | |||||||
| Fort Knox | 104,901 | 84,215 | 108,512 | 81,306 | 141.0 | 104.3 | 1,299 | 1,283 | |||||||
| Round Mountain | 42,969 | 55,764 | 45,342 | 56,495 | 80.0 | 82.6 | 1,764 | 1,462 | |||||||
| Bald Mountain | 44,642 | 44,007 | 51,291 | 49,375 | 58.7 | 57.1 | 1,144 | 1,156 | |||||||
| United States Total | 192,512 | 183,986 | 205,145 | 187,176 | 279.7 | 244.0 | 1,363 | 1,304 | |||||||
| Less: Manh Choh non-controlling interest (30%) | (13,146 | ) | - | (13,749 | ) | - | (15.9 | ) | - | ||||||
| United States Attributable Total | 179,366 | 183,986 | 191,396 | 187,176 | 263.8 | 244.0 | 1,378 | 1,304 | |||||||
| Operations Total(a) | 514,355 | 546,513 | 531,729 | 565,389 | 583.8 | 552.0 | 1,098 | 976 | |||||||
| Attributable Total(a) | 501,209 | 546,513 | 517,980 | 565,389 | 567.9 | 552.0 | 1,096 | 976 | |||||||
| Years ended December 31, | Gold equivalent ounces | ||||||||||||||
| Produced | Sold |
Production cost of sales ($millions) |
Production cost of sales/equivalent ounce sold | ||||||||||||
| 2024 | 2023 | 2024 | 2023 | 2024 | 2023 | 2024 | 2023 | ||||||||
| Tasiast | 622,394 | 620,793 | 609,614 | 615,065 | 415.4 | 406.8 | 681 | 661 | |||||||
| Paracatu | 528,574 | 587,999 | 528,209 | 592,224 | 548.6 | 538.6 | 1,039 | 909 | |||||||
| La Coipa | 246,131 | 260,138 | 241,077 | 268,491 | 231.3 | 182.8 | 959 | 681 | |||||||
| Fort Knox | 377,258 | 290,651 | 375,402 | 287,532 | 452.5 | 343.5 | 1,205 | 1,195 | |||||||
| Round Mountain | 215,387 | 235,690 | 214,996 | 234,064 | 328.3 | 357.7 | 1,527 | 1,528 | |||||||
| Bald Mountain | 181,047 | 157,749 | 182,760 | 180,139 | 220.3 | 223.5 | 1,205 | 1,241 | |||||||
| United States Total | 773,692 | 684,090 | 773,158 | 701,735 | 1,001.1 | 924.7 | 1,295 | 1,318 | |||||||
| Less: Manh Choh non-controlling interest (30%) | (42,739 | ) | - | (41,524 | ) | - | (40.8 | ) | - | ||||||
| United States Attributable Total | 730,953 | 684,090 | 731,634 | 701,735 | 960.3 | 924.7 | 1,313 | 1,318 | |||||||
| Operations Total(a) | 2,170,791 | 2,153,020 | 2,153,212 | 2,179,936 | 2,197.1 | 2,054.4 | 1,020 | 942 | |||||||
| Attributable Total(a) | 2,128,052 | 2,153,020 | 2,111,688 | 2,179,936 | 2,156.3 | 2,054.4 | 1,021 | 942 | |||||||
(a) Totals include immaterial sales and related costs from Maricunga for each period presented.
Consolidated balance sheets
| (expressed in millions of U.S. dollars, except share amounts) | |||||||||
| As at | |||||||||
| December 31, | December 31, | ||||||||
| 2024 | 2023 | ||||||||
| Assets | |||||||||
| Current assets | |||||||||
| Cash and cash equivalents | $ | 611.5 | $ | 352.4 | |||||
| Restricted cash | 10.2 | 9.8 | |||||||
| Accounts receivable and prepaid assets | 257.3 | 268.7 | |||||||
| Current income tax recoverable | 0.9 | 3.4 | |||||||
| Inventories | 1,243.2 | 1,153.0 | |||||||
| Other current assets | 3.6 | 15.0 | |||||||
| 2,126.7 | 1,802.3 | ||||||||
| Non-current assets | |||||||||
| Property, plant and equipment | 7,968.6 | 7,963.2 | |||||||
| Long-term investments | 51.9 | 54.7 | |||||||
| Other long-term assets | 713.1 | 710.6 | |||||||
| Deferred tax assets | 5.3 | 12.5 | |||||||
| Total assets | $ | 10,865.6 | $ | 10,543.3 | |||||
| Liabilities | |||||||||
| Current liabilities | |||||||||
| Accounts payable and accrued liabilities | $ | 543.0 | $ | 531.5 | |||||
| Current income tax payable | 236.7 | 92.9 | |||||||
| Current portion of long-term debt | 199.9 | - | |||||||
| Current portion of provisions | 62.5 | 48.8 | |||||||
| Other current liabilities | 18.0 | 12.3 | |||||||
| 1,060.1 | 685.5 | ||||||||
| Non-current liabilities | |||||||||
| Long-term debt | 1,235.5 | 2,232.6 | |||||||
| Provisions | 941.5 | 889.9 | |||||||
| Other long-term liabilities | 78.9 | 99.9 | |||||||
| Deferred tax liabilities | 549.0 | 449.7 | |||||||
| Total liabilities | $ | 3,865.0 | $ | 4,357.6 | |||||
| Equity | |||||||||
| Common shareholders' equity | |||||||||
| Common share capital | $ | 4,487.3 | $ | 4,481.6 | |||||
| Contributed surplus | 10,643.0 | 10,646.0 | |||||||
| Accumulated deficit | (8,181.3 | ) | (8,982.6 | ) | |||||
| Accumulated other comprehensive loss | (87.4 | ) | (61.3 | ) | |||||
| Total common shareholders' equity | 6,861.6 | 6,083.7 | |||||||
| Non-controlling interests | 139.0 | 102.0 | |||||||
| Total equity | $ | 7,000.6 | $ | 6,185.7 | |||||
| Total liabilities and equity | $ | 10,865.6 | $ | 10,543.3 | |||||
| Common shares | |||||||||
| Authorized |
Unlimited |
Unlimited | |||||||
| Issued and outstanding | 1,229,125,606 | 1,227,837,974 | |||||||
Consolidated statements of operations
| (expressed in millions of U.S. dollars, except per share amounts) | |||||||||
| Years ended | |||||||||
| December 31, | December 31, | ||||||||
| 2024 | 2023 | ||||||||
| Revenue | |||||||||
| Metal sales | $ | 5,148.8 | $ | 4,239.7 | |||||
| Cost of sales | |||||||||
| Production cost of sales | 2,197.1 | 2,054.4 | |||||||
| Depreciation, depletion and amortization | 1,147.5 | 986.8 | |||||||
| Impairment (reversal) charge | (74.1 | ) | 38.9 | ||||||
| Total cost of sales | 3,270.5 | 3,080.1 | |||||||
| Gross profit | 1,878.3 | 1,159.6 | |||||||
| Other operating expense | 14.0 | 64.5 | |||||||
| Exploration and business development | 197.8 | 185.0 | |||||||
| General and administrative | 126.2 | 108.7 | |||||||
| Operating earnings | 1,540.3 | 801.4 | |||||||
| Other income (expense) - net | 14.3 | (27.3 | ) | ||||||
| Finance income | 18.2 | 40.5 | |||||||
| Finance expense | (91.4 | ) | (106.0 | ) | |||||
| Earnings before tax | 1,481.4 | 708.6 | |||||||
| Income tax expense - net | (487.4 | ) | (293.2 | ) | |||||
| Net earnings | $ | 994.0 | $ | 415.4 | |||||
| Net earnings (loss) attributable to: | |||||||||
| Non-controlling interests | $ | 45.2 | $ | (0.9 | ) | ||||
| Common shareholders | $ | 948.8 | $ | 416.3 | |||||
| Earnings per share attributable to common shareholders | |||||||||
| Basic | $ | 0.77 | $ | 0.34 | |||||
| Diluted | $ | 0.77 | $ | 0.34 | |||||
Consolidated statements of cash flows
| (expressed in millions of U.S. dollars) | |||||||||
| Years ended | |||||||||
| December 31, | December 31, | ||||||||
| 2024 | 2023 | ||||||||
| Net inflow (outflow) of cash related to the following activities: | |||||||||
| Operating: | |||||||||
| Net earnings | $ | 994.0 | $ | 415.4 | |||||
| Adjustments to reconcile net earnings to net cash provided from operating activities: | |||||||||
| Depreciation, depletion and amortization | 1,147.5 | 986.8 | |||||||
| Impairment (reversal) charge | (74.1 | ) | 38.9 | ||||||
| Share-based compensation expense | 9.0 | 6.7 | |||||||
| Finance expense | 91.4 | 106.0 | |||||||
| Deferred tax expense | 112.2 | 143.9 | |||||||
| Foreign exchange gains and other | (59.1 | ) | (8.6 | ) | |||||
| Reclamation expense (recovery) | 6.9 | (19.2 | ) | ||||||
| Changes in operating assets and liabilities: | |||||||||
| Accounts receivable and other assets | 11.7 | 68.7 | |||||||
| Inventories | 14.3 | (91.4 | ) | ||||||
| Accounts payable and accrued liabilities | 370.8 | 95.5 | |||||||
| Cash flow provided from operating activities | 2,624.6 | 1,742.7 | |||||||
| Income taxes paid | (178.2 | ) | (137.4 | ) | |||||
| Net cash flow provided from operating activities | 2,446.4 | 1,605.3 | |||||||
| Investing: | |||||||||
| Additions to property, plant and equipment | (1,075.5 | ) | (1,098.3 | ) | |||||
| Interest paid capitalized to property, plant and equipment | (92.6 | ) | (114.1 | ) | |||||
| Net (additions) disposals to long-term investments and other assets | (38.4 | ) | 1.7 | ||||||
| (Increase) decrease in restricted cash - net | (0.4 | ) | 25.3 | ||||||
| Interest received and other - net | 17.0 | 18.2 | |||||||
| Net cash flow of continuing operations used in investing activities | (1,189.9 | ) | (1,167.2 | ) | |||||
| Net cash flow of discontinued operations provided from investing activities | 10.0 | 45.0 | |||||||
| Financing: | |||||||||
| Repayment of debt | (800.0 | ) | (960.0 | ) | |||||
| Proceeds from issuance or drawdown of debt | - | 588.1 | |||||||
| Interest paid | (35.6 | ) | (53.2 | ) | |||||
| Payment of lease liabilities | (12.1 | ) | (30.2 | ) | |||||
| Funding from non-controlling interest | 31.3 | 46.2 | |||||||
| Distributions paid to non-controlling interest | (40.5 | ) | - | ||||||
| Dividends paid to common shareholders | (147.5 | ) | (147.3 | ) | |||||
| Other - net | (1.5 | ) | 7.4 | ||||||
| Net cash flow used in financing activities | (1,005.9 | ) | (549.0 | ) | |||||
| Effect of exchange rate changes on cash and cash equivalents | (1.5 | ) | 0.2 | ||||||
| Increase (decrease) in cash and cash equivalents | 259.1 | (65.7 | ) | ||||||
| Cash and cash equivalents, beginning of period | 352.4 | 418.1 | |||||||
| Cash and cash equivalents, end of period | $ | 611.5 | $ | 352.4 | |||||
| Operating Summary | |||||||||||||||||||
| Mine | Period | Tonnes Ore Mined | Ore Processed (Milled) | Ore Processed (Heap Leach) | Grade (Mill) | Grade (Heap Leach) | Recovery (a)(b) | Gold Eq Production(c) | Gold Eq Sales(c) | Production cost of sales | Production cost of sales/oz(d) | Cap Ex - sustaining(e) | Total Cap Ex (e) | ||||||
| ('000 tonnes) | ('000 tonnes) | ('000 tonnes) | (g/t) | (g/t) | (%) | (ounces) | (ounces) | ($ millions) | ($/ounce) | ($ millions) | ($ millions) | ||||||||
| West Africa | Tasiast | Q4 2024 | 1,824 | 2,205 | - | 2.13 | - | 94 | % | 139,411 | 144,041 | $ | 104.4 | $ | 725 | $ | 33.7 | $ | 105.4 |
| Q3 2024 | 1,748 | 2,203 | - | 2.46 | - | 91 | % | 162,155 | 158,521 | $ | 109.0 | $ | 688 | $ | 13.5 | $ | 83.8 | ||
| Q2 2024 | 1,985 | 2,161 | - | 2.70 | - | 92 | % | 161,629 | 156,038 | $ | 102.3 | $ | 656 | $ | 7.0 | $ | 75.2 | ||
| Q1 2024 | 2,044 | 2,073 | - | 2.46 | - | 91 | % | 159,199 | 151,014 | $ | 99.7 | $ | 660 | $ | 10.1 | $ | 79.5 | ||
| Q4 2023 | 2,937 | 2,056 | - | 3.04 | - | 93 | % | 160,764 | 171,199 | $ | 110.4 | $ | 645 | $ | 9.7 | $ | 85.2 | ||
| Americas | Paracatu | Q4 2024 | 12,944 | 13,116 | - | 0.40 | - | 80 | % | 123,899 | 124,690 | $ | 131.6 | $ | 1,055 | $ | 35.1 | $ | 35.1 |
| Q3 2024 | 13,127 | 14,551 | - | 0.38 | - | 81 | % | 146,174 | 145,235 | $ | 146.1 | $ | 1,006 | $ | 41.2 | $ | 41.2 | ||
| Q2 2024 | 14,094 | 15,053 | - | 0.35 | - | 80 | % | 130,228 | 130,174 | $ | 135.2 | $ | 1,039 | $ | 44.6 | $ | 44.6 | ||
| Q1 2024 | 14,078 | 15,609 | - | 0.31 | - | 79 | % | 128,273 | 128,110 | $ | 135.7 | $ | 1,059 | $ | 19.6 | $ | 19.6 | ||
| Q4 2023 | 16,865 | 15,279 | - | 0.35 | - | 79 | % | 127,940 | 132,886 | $ | 144.2 | $ | 1,085 | $ | 41.6 | $ | 41.6 | ||
| La Coipa(f) | Q4 2024 | 1,385 | 1,017 | - | 1.98 | - | 79 | % | 58,533 | 57,852 | $ | 68.2 | $ | 1,179 | $ | 26.6 | $ | 26.6 | |
| Q3 2024 | 786 | 809 | - | 2.17 | - | 80 | % | 50,502 | 48,594 | $ | 52.2 | $ | 1,074 | $ | 21.3 | $ | 24.9 | ||
| Q2 2024 | 690 | 882 | - | 1.97 | - | 84 | % | 65,851 | 63,506 | $ | 58.8 | $ | 926 | $ | 10.7 | $ | 10.7 | ||
| Q1 2024 | 1,035 | 827 | - | 2.09 | - | 87 | % | 71,245 | 71,125 | $ | 52.1 | $ | 733 | $ | 7.2 | $ | 7.2 | ||
| Q4 2023 | 1,591 | 1,188 | - | 1.92 | - | 78 | % | 73,823 | 73,477 | $ | 52.9 | $ | 720 | $ | 7.0 | $ | 10.9 | ||
| Fort Knox (100%)(g) | Q4 2024 | 7,692 | 1,524 | 6,664 | 1.51 | 0.21 | 82 | % | 104,901 | 108,512 | $ | 141.0 | $ | 1,299 | $ | 53.3 | $ | 54.0 | |
| Q3 2024 | 7,612 | 1,105 | 5,822 | 4.03 | 0.19 | 91 | % | 149,093 | 140,121 | $ | 134.2 | $ | 958 | $ | 56.6 | $ | 70.4 | ||
| Q2 2024 | 8,331 | 2,003 | 6,385 | 0.85 | 0.22 | 81 | % | 69,914 | 70,477 | $ | 94.8 | $ | 1,345 | $ | 47.6 | $ | 89.2 | ||
| Q1 2024 | 10,037 | 1,850 | 8,778 | 0.67 | 0.24 | 76 | % | 53,350 | 56,292 | $ | 82.5 | $ | 1,466 | $ | 37.7 | $ | 78.6 | ||
| Q4 2023 | 11,018 | 2,173 | 9,930 | 0.69 | 0.22 | 78 | % | 84,215 | 81,306 | $ | 104.3 | $ | 1,283 | $ | 50.6 | $ | 114.3 | ||
|
Fort Knox (attributable)(g) |
Q4 2024 | 7,619 | 1,483 | 6,664 | 1.28 | 0.21 | 81 | % | 91,755 | 94,763 | $ | 125.1 | $ | 1,320 | $ | 51.1 | $ | 52.1 | |
| Q3 2024 | 7,509 | 991 | 5,822 | 3.44 | 0.19 | 91 | % | 119,500 | 112,346 | $ | 109.3 | $ | 973 | $ | 55.4 | $ | 67.2 | ||
| Q2 2024 | 8,249 | 2,003 | 6,385 | 0.85 | 0.22 | 81 | % | 69,914 | 70,477 | $ | 94.8 | $ | 1,345 | $ | 47.6 | $ | 79.5 | ||
| Q1 2024 | 10,009 | 1,850 | 8,778 | 0.67 | 0.24 | 76 | % | 53,350 | 56,292 | $ | 82.5 | $ | 1,466 | $ | 37.7 | $ | 68.8 | ||
| Q4 2023 | 11,014 | 2,173 | 9,930 | 0.69 | 0.22 | 78 | % | 84,215 | 81,306 | $ | 104.3 | $ | 1,283 | $ | 50.6 | $ | 100.7 | ||
| Round Mountain | Q4 2024 | 3,111 | 768 | 1,736 | 1.05 | 0.22 | 82 | % | 42,969 | 45,342 | $ | 80.0 | $ | 1,764 | $ | 4.4 | $ | 33.9 | |
| Q3 2024 | 2,958 | 790 | 1,032 | 0.74 | 0.29 | 80 | % | 42,279 | 41,436 | $ | 63.8 | $ | 1,540 | $ | 5.2 | $ | 35.9 | ||
| Q2 2024 | 2,956 | 806 | 1,541 | 1.11 | 0.35 | 73 | % | 61,787 | 60,049 | $ | 93.9 | $ | 1,564 | $ | 2.1 | $ | 37.2 | ||
| Q1 2024 | 4,246 | 960 | 3,257 | 1.32 | 0.37 | 73 | % | 68,352 | 68,169 | $ | 90.6 | $ | 1,329 | $ | 3.7 | $ | 19.3 | ||
| Q4 2023 | 4,666 | 884 | 2,729 | 0.91 | 0.48 | 68 | % | 55,764 | 56,495 | $ | 82.6 | $ | 1,462 | $ | 4.6 | $ | 4.8 | ||
| Bald Mountain | Q4 2024 | 7,622 | - | 7,622 | - | 0.46 | nm | 44,642 | 51,291 | $ | 58.7 | $ | 1,144 | $ | 4.6 | $ | 6.4 | ||
| Q3 2024 | 6,384 | - | 6,384 | - | 0.53 | nm | 43,496 | 44,410 | $ | 58.9 | $ | 1,326 | $ | 5.0 | $ | 6.1 | |||
| Q2 2024 | 2,906 | - | 2,906 | - | 0.47 | nm | 45,929 | 39,818 | $ | 50.6 | $ | 1,271 | $ | 4.4 | $ | 4.6 | |||
| Q1 2024 | 1,480 | - | 1,480 | - | 0.42 | nm | 46,980 | 47,241 | $ | 52.1 | $ | 1,103 | $ | 32.4 | $ | 32.4 | |||
| Q4 2023 | 3,894 | - | 3,918 | - | 0.47 | nm | 44,007 | 49,375 | $ | 57.1 | $ | 1,156 | $ | 36.3 | $ | 38.8 | |||
(a) Due to the nature of heap leach operations, recovery rates at Bald Mountain cannot be accurately measured on a quarterly basis. Recovery rates at Fort Knox and Round Mountain represent mill recovery only.
(b) "nm" means not meaningful.
(c) Gold equivalent ounces include silver ounces produced and sold converted to a gold equivalent based on the ratio of the average spot market prices for the commodities for each period. The ratios for the quarters presented are as follows: Q4 2024: 84.67:1; Q3 2024: 84.06:1; Q2 2024: 81.06:1; Q1 2024: 88.70:1; Q4 2023: 85.00:1.
(d) “Production cost of sales per equivalent ounce sold” is defined as production cost of sales divided by total gold equivalent ounces sold.
(e) "Total Cap Ex" is as reported as “Additions to property, plant and equipment” on the consolidated statements of cash flows. "Cap Ex - sustaining" is a non-GAAP financial measure. The definition and reconciliation of this non-GAAP financial measure is included on pages 30 to 31 of this news release.
(f) La Coipa silver grade and recovery were as follows: Q4 2024: 42.57 g/t, 43%; Q3 2024: 49.13 g/t, 58%; Q2 2024: 65.02 g/t, 51%; Q1 2024: 87.20 g/t, 58%; Q4 2023: 96.24 g/t, 44%.
(g) The Fort Knox segment is composed of Fort Knox and Manh Choh, and comparative results shown are presented in accordance with the current year’s presentation. Manh Choh tonnes of ore processed and grade were as follows: Q4 2024: 138,937 tonnes, 9.58 g/t; Q3 2024: 379,786 tonnes, 9.13 g/t. Tonnes of ore processed and grade were nil for all other periods presented as production commenced in July 2024. The attributable results for Fort Knox include 100% of Fort Knox and 70% of Manh Choh.
Reconciliation of non-GAAP financial measures and ratios
The Company has included certain non-GAAP financial measures and ratios in this document. These financial measures and ratios are not defined under IFRS and should not be considered in isolation. The Company believes that these financial measures and ratios, together with financial measures and ratios determined in accordance with IFRS, provide investors with an improved ability to evaluate the underlying performance of the Company. The inclusion of these financial measures and ratios is meant to provide additional information and should not be used as a substitute for performance measures prepared in accordance with IFRS. These financial measures and ratios are not necessarily standard and therefore may not be comparable to other issuers.
Adjusted Net Earnings Attributable to Common Shareholders and Adjusted Net Earnings per Share
Adjusted net earnings attributable to common shareholders and adjusted net earnings per share are non-GAAP financial measures and ratios which determine the performance of the Company, excluding certain impacts which the Company believes are not reflective of the Company’s underlying performance for the reporting period, such as the impact of foreign exchange gains and losses, reassessment of prior year taxes and/or taxes otherwise not related to the current period, impairment charges (reversals), gains and losses and other one-time costs related to acquisitions, dispositions and other transactions, and non-hedge derivative gains and losses. Although some of the items are recurring, the Company believes that they are not reflective of the underlying operating performance of its current business and are not necessarily indicative of future operating results. Management believes that these measures and ratios, which are used internally to assess performance and in planning and forecasting future operating results, provide investors with the ability to better evaluate underlying performance, particularly since the excluded items are typically not included in public guidance. However, adjusted net earnings and adjusted net earnings per share measures and ratios are not necessarily indicative of net earnings and earnings per share measures and ratios as determined under IFRS.
The following table provides a reconciliation of net earnings to adjusted net earnings for the periods presented:
| Three months ended | Years ended | |||||||||||||
| (expressed in millions of U.S. dollars, except per share amounts) | December 31, | December 31, | ||||||||||||
| 2024 | 2023 | 2024 | 2023 | |||||||||||
| Net earnings attributable to common shareholders - as reported | $ | 275.6 | $ | 65.4 | $ | 948.8 | $ | 416.3 | ||||||
| Adjusting items: | ||||||||||||||
| Foreign exchange (gains) losses | (22.2 | ) | 2.7 | (27.3 | ) | 1.9 | ||||||||
| Foreign exchange losses on translation of tax basis and foreign exchange on deferred income taxes within income tax expense | 54.4 | 24.1 | 86.4 | 29.3 | ||||||||||
| Taxes in respect of prior periods | (37.8 | ) | (19.9 | ) | (60.7 | ) | 13.9 | |||||||
| Impairment (reversal) charge | - | 38.9 | (74.1 | ) | 38.9 | |||||||||
| Loss on sale of assets | 3.5 | 8.1 | 6.0 | 14.8 | ||||||||||
| Insurance recoveries | - | - | (22.9 | ) | (1.2 | ) | ||||||||
| Settlement provisions | (5.6 | ) | 20.0 | 2.6 | 30.0 | |||||||||
| Reclamation expense (recovery) | 6.9 | (5.1 | ) | 6.9 | (19.2 | ) | ||||||||
| Other adjustments related to prior periods | (27.8 | ) | - | (27.8 | ) | - | ||||||||
| Other(a) | (10.4 | ) | 8.2 | (4.9 | ) | 19.3 | ||||||||
| Tax effects of the above adjustments | 3.4 | (2.4 | ) | 5.3 | (4.2 | ) | ||||||||
| (35.6 | ) | 74.6 | (110.5 | ) | 123.5 | |||||||||
| Adjusted net earnings attributable to common shareholders | $ | 240.0 | $ | 140.0 | $ | 838.3 | $ | 539.8 | ||||||
| Weighted average number of common shares outstanding - Basic | 1,229.1 | 1,227.8 | 1,228.9 | 1,227.0 | ||||||||||
| Adjusted net earnings per share | $ | 0.20 | $ | 0.11 | $ | 0.68 | $ | 0.44 | ||||||
| Basic earnings per share attributable to common shareholders - as reported | $ | 0.22 | $ | 0.06 | $ | 0.77 | $ | 0.34 | ||||||
(a) Other includes various impacts, such as one-time costs and recoveries at sites, restructuring costs, as well as gains and losses on hedges, which the Company believes are not reflective of the Company’s underlying performance for the reporting period.
Attributable Free Cash Flow
Attributable free cash flow is a non-GAAP financial measure and is defined as net cash flow provided from operating activities less attributable capital expenditures and non-controlling interest included in net cash flows provided from operating activities. The Company believes that this measure, which is used internally to evaluate the Company’s underlying cash generation performance and the ability to repay creditors and return cash to shareholders, provides investors with the ability to better evaluate the Company’s underlying performance. However, this measure is not necessarily indicative of operating earnings or net cash flow provided from operating activities as determined under IFRS.
The following table provides a reconciliation of attributable free cash flow for the periods presented:
| Three months ended | Years ended | |||||||||||||
| (expressed in millions of U.S. dollars) | December 31, | December 31, | ||||||||||||
| 2024 | 2023 | 2024 | 2023 | |||||||||||
| Net cash flow provided from operating activities - as reported | $ | 734.5 | $ | 410.9 | $ | 2,446.4 | $ | 1,605.3 | ||||||
| Adjusting items: | ||||||||||||||
| Attributable(a) capital expenditures | (278.8 | ) | (297.7 | ) | (1,050.9 | ) | (1,055.0 | ) | ||||||
| Non-controlling interest(b) cash flow (from) used in operating activities | (21.3 | ) | 3.5 | (55.3 | ) | 9.4 | ||||||||
| Attributable(a) free cash flow | $ | 434.4 | $ | 116.7 | $ | 1,340.2 | $ | 559.7 | ||||||
See pages 31 and 32 for details of the endnotes referenced within the table above.
Attributable Adjusted Operating Cash Flow
Attributable adjusted operating cash flow is a non-GAAP financial measure and is defined as net cash flow provided from operating activities excluding changes in working capital, certain impacts which the Company believes are not reflective of the Company’s regular operating cash flow, and net cash flows provided from operating activities, net of working capital changes, relating to non-controlling interests. Working capital can be volatile due to numerous factors, including the timing of tax payments. The Company uses attributable adjusted operating cash flow internally as a measure of the underlying operating cash flow performance and future operating cash flow-generating capability of the Company. However, the attributable adjusted operating cash flow measure is not necessarily indicative of net cash flow provided from operating activities as determined under IFRS.
The following table provides a reconciliation of attributable adjusted operating cash flow for the periods presented:
| Three months ended | Years ended | |||||||||||||
| (expressed in millions of U.S. dollars) | December 31, | December 31, | ||||||||||||
| 2024 | 2023 | 2024 | 2023 | |||||||||||
| Net cash flow provided from operating activities - as reported | $ | 734.5 | $ | 410.9 | $ | 2,446.4 | $ | 1,605.3 | ||||||
| Adjusting items: | ||||||||||||||
| Insurance proceeds received in respect of prior years | - | - | (22.9 | ) | - | |||||||||
| Working capital changes: | ||||||||||||||
| Accounts receivable and other assets | (27.6 | ) | (2.1 | ) | (11.7 | ) | (68.7 | ) | ||||||
| Inventories | (17.4 | ) | (1.8 | ) | (14.3 | ) | 91.4 | |||||||
| Accounts payable and other liabilities, including income taxes paid | (55.3 | ) | 0.4 | (192.6 | ) | 41.9 | ||||||||
| 634.2 | 407.4 | 2,204.9 | 1,669.9 | |||||||||||
| Non-controlling interest(b) cash flow (from) used in operating activities, net of working capital changes | (20.1 | ) | 2.2 | (61.8 | ) | 6.8 | ||||||||
| Attributable(a) adjusted operating cash flow | $ | 614.1 | $ | 409.6 | $ | 2,143.1 | $ | 1,676.7 | ||||||
See pages 31 and 32 for details of the endnotes referenced within the table above.
Attributable Average Realized Gold Price per Ounce
Attributable average realized gold price per ounce is a non-GAAP ratio which calculates the average price realized from gold sales attributable to the Company. The Company believes that this measure provides a more accurate measure with which to compare the Company's gold sales performance to market gold prices. The following table provides a reconciliation of attributable average realized gold price per ounce for the periods presented:
| (expressed in millions of U.S. dollars, except ounces and average realized gold price per ounce) | Three months ended December 31, |
Years ended December 31, |
|||||||||||
| 2024 | 2023 | 2024 | 2023 | ||||||||||
| Metal sales - as reported | $ | 1,415.8 | $ | 1,115.7 | $ | 5,148.8 | $ | 4,239.7 | |||||
| Less: silver revenue(c) | (24.6 | ) | (43.7 | ) | (121.9 | ) | (204.3 | ) | |||||
| Less: non-controlling interest(b) gold revenue | (35.5 | ) | - | (103.0 | ) | - | |||||||
| Attributable(a) gold revenue | $ | 1,355.7 | $ | 1,072.0 | $ | 4,923.9 | $ | 4,035.4 | |||||
| Gold ounces sold | 522,389 | 543,173 | 2,100,621 | 2,074,989 | |||||||||
| Less: non-controlling interest(b) gold ounces sold | (13,649 | ) | - | (41,325 | ) | - | |||||||
| Attributable(a) gold ounces sold | 508,740 | 543,173 | 2,059,296 | 2,074,989 | |||||||||
| Attributable(a) average realized gold price per ounce | $ | 2,665 | $ | 1,974 | $ | 2,391 | $ | 1,945 | |||||
| Average realized gold price per ounce(d) | $ | 2,663 | $ | 1,974 | $ | 2,393 | $ | 1,945 | |||||
See page 31 and 32 for details of the endnotes referenced within the table above.
Attributable Production Cost of Sales per Equivalent Ounce Sold
Production cost of sales per equivalent ounce sold is defined as production cost of sales, as reported on the consolidated statement of operations, divided by the total number of gold equivalent ounces sold. This measure converts the Company’s non-gold production into gold equivalent ounces and credits it to total production.
Attributable production cost of sales per equivalent ounce sold is a non-GAAP ratio and is defined as attributable production cost of sales divided by the attributable number of gold equivalent ounces sold. This measure converts the Company’s attributable non-gold production into gold equivalent ounces and credits it to total attributable production. Management uses this measure to monitor and evaluate the performance of its operating properties that are attributable to its shareholders.
The following table provides a reconciliation of production cost of sales and attributable production cost of sales per equivalent ounce sold for the periods presented:
| (expressed in millions of U.S. dollars, except ounces and production cost of sales per equivalent ounce) | Three months ended December 31, |
Years ended December 31, |
||||||||||||
| 2024 | 2023 | 2024 | 2023 | |||||||||||
| Production cost of sales - as reported | $ | 583.8 | $ | 552.0 | $ | 2,197.1 | $ | 2,054.4 | ||||||
| Less: non-controlling interest(b) production cost of sales | (15.9 | ) | - | (40.8 | ) | - | ||||||||
| Attributable(a) production cost of sales | $ | 567.9 | $ | 552.0 | $ | 2,156.3 | $ | 2,054.4 | ||||||
| Gold equivalent ounces sold | 531,729 | 565,389 | 2,153,212 | 2,179,936 | ||||||||||
| Less: non-controlling interest(b) gold equivalent ounces sold | (13,749 | ) | - | (41,524 | ) | - | ||||||||
| Attributable(a) gold equivalent ounces sold | 517,980 | 565,389 | 2,111,688 | 2,179,936 | ||||||||||
| Attributable(a) production cost of sales per equivalent ounce sold | $ | 1,096 | $ | 976 | $ | 1,021 | $ | 942 | ||||||
| Production cost of sales per equivalent ounce sold(e) | $ | 1,098 | $ | 976 | $ | 1,020 | $ | 942 | ||||||
See pages 31 and 32 for details of the endnotes referenced within the table above.
Attributable Production Cost of Sales per Ounce Sold on a By-Product Basis
Attributable production cost of sales per ounce sold on a by-product basis is a non-GAAP ratio which calculates the Company’s non-gold production as a credit against its per ounce production costs, rather than converting its non-gold production into gold equivalent ounces and crediting it to total production, as is the case in co-product accounting. Management believes that this ratio provides investors with the ability to better evaluate Kinross’ production cost of sales per ounce on a comparable basis with other major gold producers who routinely calculate their cost of sales per ounce using by-product accounting rather than co-product accounting.
The following table provides a reconciliation of attributable production cost of sales per ounce sold on a by-product basis for the periods presented:
| (expressed in millions of U.S. dollars, except ounces and production cost of sales per ounce) | Three months ended December 31, |
Years ended December 31, |
||||||||||||
| 2024 | 2023 | 2024 | 2023 | |||||||||||
| Production cost of sales - as reported | $ | 583.8 | $ | 552.0 | $ | 2,197.1 | $ | 2,054.4 | ||||||
| Less: non-controlling interest(b) production cost of sales | (15.9 | ) | - | (40.8 | ) | - | ||||||||
| Less: attributable(a) silver revenue(c) | (24.2 | ) | (43.7 | ) | (121.4 | ) | (204.3 | ) | ||||||
| Attributable(a) production cost of sales net of silver by-product revenue | $ | 543.7 | $ | 508.3 | $ | 2,034.9 | $ | 1,850.1 | ||||||
| Gold ounces sold | 522,389 | 543,173 | 2,100,621 | 2,074,989 | ||||||||||
| Less: non-controlling interest(b) gold ounces sold | (13,649 | ) | - | (41,325 | ) | - | ||||||||
| Attributable(a) gold ounces sold | 508,740 | 543,173 | 2,059,296 | 2,074,989 | ||||||||||
| Attributable(a) production cost of sales per ounce sold on a by-product basis | $ | 1,069 | $ | 936 | $ | 988 | $ | 892 | ||||||
| Production cost of sales per equivalent ounce sold(e) | $ | 1,098 | $ | 976 | $ | 1,020 | $ | 942 | ||||||
See pages 31 and 32 for details of the endnotes referenced within the table above.
Attributable All-In Sustaining Cost and All-In Cost per Ounce Sold on a By-Product Basis
Attributable all-in sustaining cost and all-in cost per ounce sold on a by-product basis are non-GAAP financial measures and ratios, as applicable, calculated based on guidance published by the World Gold Council (“WGC”). The WGC is a market development organization for the gold industry and is an association whose membership comprises leading gold mining companies including Kinross. Although the WGC is not a mining industry regulatory organization, it worked closely with its member companies to develop these metrics. Adoption of the all-in sustaining cost and all-in cost metrics is voluntary and not necessarily standard, and therefore, these measures and ratios presented by the Company may not be comparable to similar measures and ratios presented by other issuers. The Company believes that the all-in sustaining cost and all-in cost measures complement existing measures and ratios reported by Kinross.
All-in sustaining cost includes both operating and capital costs required to sustain gold production on an ongoing basis. The value of silver sold is deducted from the total production cost of sales as it is considered residual production, i.e. a by-product. Sustaining operating costs represent expenditures incurred at current operations that are considered necessary to maintain current production. Sustaining capital represents capital expenditures at existing operations comprising mine development costs, including capitalized development, and ongoing replacement of mine equipment and other capital facilities, and does not include capital expenditures for major growth projects or enhancement capital for significant infrastructure improvements at existing operations.
All-in cost is comprised of all-in sustaining cost as well as operating expenditures incurred at locations with no current operation, or costs related to other non-sustaining activities, and capital expenditures for major growth projects or enhancement capital for significant infrastructure improvements at existing operations.
Attributable all-in sustaining cost and all-in cost per ounce sold on a by-product basis are calculated by adjusting production cost of sales, as reported on the consolidated statements of operations, as follows:
| Three months ended | Years ended | |||||||||||||
| (expressed in millions of U.S. dollars, except ounces and costs per ounce) | December 31, | December 31, | ||||||||||||
| 2024 | 2023 | 2024 | 2023 | |||||||||||
| Production cost of sales - as reported | $ | 583.8 | $ | 552.0 | $ | 2,197.1 | $ | 2,054.4 | ||||||
| Less: non-controlling interest(b) production cost of sales | (15.9 | ) | - | (40.8 | ) | - | ||||||||
| Less: attributable(a) silver revenue(c) | (24.2 | ) | (43.7 | ) | (121.4 | ) | (204.3 | ) | ||||||
| Attributable(a) production cost of sales net of silver by-product revenue | $ | 543.7 | $ | 508.3 | $ | 2,034.9 | $ | 1,850.1 | ||||||
| Adjusting items on an attributable(a) basis: | ||||||||||||||
| General and administrative(f) | 31.9 | 26.5 | 122.2 | 106.9 | ||||||||||
| Other operating expense - sustaining(g) | (0.9 | ) | 5.2 | 4.0 | 23.0 | |||||||||
| Reclamation and remediation - sustaining(h) | 15.3 | 16.4 | 71.4 | 63.1 | ||||||||||
| Exploration and business development - sustaining(i) | 10.1 | 10.4 | 42.5 | 38.3 | ||||||||||
| Additions to property, plant and equipment - sustaining(j) | 155.9 | 150.1 | 523.5 | 554.3 | ||||||||||
| Lease payments - sustaining(k) | 1.9 | 4.6 | 11.8 | 29.5 | ||||||||||
| All-in Sustaining Cost on a by-product basis - attributable(a) | $ | 757.9 | $ | 721.5 | $ | 2,810.3 | $ | 2,665.2 | ||||||
| Adjusting items on an attributable(a) basis: | ||||||||||||||
| Other operating expense - non-sustaining(g) | 20.3 | 11.1 | 53.1 | 38.5 | ||||||||||
| Reclamation and remediation - non-sustaining(h) | 1.7 | 2.2 | 6.8 | 7.7 | ||||||||||
| Exploration and business development - non-sustaining(i) | 40.4 | 40.1 | 153.4 | 145.9 | ||||||||||
| Additions to property, plant and equipment - non-sustaining(j) | 122.9 | 147.6 | 527.4 | 500.7 | ||||||||||
| Lease payments - non-sustaining(k) | 0.1 | 0.1 | 0.3 | 0.7 | ||||||||||
| All-in Cost on a by-product basis - attributable(a) | $ | 943.3 | $ | 922.6 | $ | 3,551.3 | $ | 3,358.7 | ||||||
| Gold ounces sold | 522,389 | 543,173 | 2,100,621 | 2,074,989 | ||||||||||
| Less: non-controlling interest(b) gold ounces sold | (13,649 | ) | - | (41,325 | ) | - | ||||||||
| Attributable(a) gold ounces sold | 508,740 | 543,173 | 2,059,296 | 2,074,989 | ||||||||||
| Attributable(a) all-in sustaining cost per ounce sold on a by-product basis | $ | 1,490 | $ | 1,328 | $ | 1,365 | $ | 1,284 | ||||||
| Attributable(a) all-in cost per ounce sold on a by-product basis | $ | 1,854 | $ | 1,699 | $ | 1,725 | $ | 1,619 | ||||||
| Production cost of sales per equivalent ounce sold(e) | $ | 1,098 | $ | 976 | $ | 1,020 | $ | 942 | ||||||
See pages 31 and 32 for details of the endnotes referenced within the table above.
Attributable All-In Sustaining Cost and All-In Cost per Equivalent Ounce Sold
The Company also assesses its attributable all-in sustaining cost and all-in cost on a gold equivalent ounce basis. Under these non-GAAP financial measures and ratios, the Company’s production of silver is converted into gold equivalent ounces and credited to total production.
Attributable all-in sustaining cost and all-in cost per equivalent ounce sold are calculated by adjusting production cost of sales, as reported on the consolidated statements of operations, as follows:
| Three months ended | Years ended | |||||||||||||
| (expressed in millions of U.S. dollars, except ounces and costs per ounce) | December 31, | December 31, | ||||||||||||
| 2024 | 2023 | 2024 | 2023 | |||||||||||
| Production cost of sales - as reported | $ | 583.8 | $ | 552.0 | $ | 2,197.1 | $ | 2,054.4 | ||||||
| Less: non-controlling interest(b) production cost of sales | (15.9 | ) | - | (40.8 | ) | - | ||||||||
| Attributable(a) production cost of sales | $ | 567.9 | $ | 552.0 | $ | 2,156.3 | $ | 2,054.4 | ||||||
| Adjusting items on an attributable(a) basis: | ||||||||||||||
| General and administrative(f) | 31.9 | 26.5 | 122.2 | 106.9 | ||||||||||
| Other operating expense - sustaining(g) | (0.9 | ) | 5.2 | 4.0 | 23.0 | |||||||||
| Reclamation and remediation - sustaining(h) | 15.3 | 16.4 | 71.4 | 63.1 | ||||||||||
| Exploration and business development - sustaining(i) | 10.1 | 10.4 | 42.5 | 38.3 | ||||||||||
| Additions to property, plant and equipment - sustaining(j) | 155.9 | 150.1 | 523.5 | 554.3 | ||||||||||
| Lease payments - sustaining(k) | 1.9 | 4.6 | 11.8 | 29.5 | ||||||||||
| All-in Sustaining Cost - attributable(a) | $ | 782.1 | $ | 765.2 | $ | 2,931.7 | $ | 2,869.5 | ||||||
| Adjusting items on an attributable(a) basis: | ||||||||||||||
| Other operating expense - non-sustaining(g) | 20.3 | 11.1 | 53.1 | 38.5 | ||||||||||
| Reclamation and remediation - non-sustaining(h) | 1.7 | 2.2 | 6.8 | 7.7 | ||||||||||
| Exploration and business development - non-sustaining(i) | 40.4 | 40.1 | 153.4 | 145.9 | ||||||||||
| Additions to property, plant and equipment - non-sustaining(j) | 122.9 | 147.6 | 527.4 | 500.7 | ||||||||||
| Lease payments - non-sustaining(k) | 0.1 | 0.1 | 0.3 | 0.7 | ||||||||||
| All-in Cost - attributable(a) | $ | 967.5 | $ | 966.3 | $ | 3,672.7 | $ | 3,563.0 | ||||||
| Gold equivalent ounces sold | 531,729 | 565,389 | 2,153,212 | 2,179,936 | ||||||||||
| Less: non-controlling interest(b) gold equivalent ounces sold | (13,749 | ) | - | (41,524 | ) | - | ||||||||
| Attributable(a) gold equivalent ounces sold | 517,980 | 565,389 | 2,111,688 | 2,179,936 | ||||||||||
| Attributable(a) all-in sustaining cost per equivalent ounce sold | $ | 1,510 | $ | 1,353 | $ | 1,388 | $ | 1,316 | ||||||
| Attributable(a) all-in cost per equivalent ounce sold | $ | 1,868 | $ | 1,709 | $ | 1,739 | $ | 1,634 | ||||||
| Production cost of sales per equivalent ounce sold(e) | $ | 1,098 | $ | 976 | $ | 1,020 | $ | 942 | ||||||
See pages 31 and 32 for details of the endnotes referenced within the table above.
Capital Expenditures and Attributable Capital Expenditures
Capital expenditures are classified as either sustaining capital expenditures or non-sustaining capital expenditures, depending on the nature of the expenditure. Sustaining capital expenditures typically represent capital expenditures at existing operations including capitalized exploration costs and capitalized development unless related to major projects, ongoing replacement of mine equipment and other capital facilities and other capital expenditures and is calculated as total additions to property, plant and equipment (as reported on the consolidated statements of cash flows), less non-sustaining capital expenditures. Non-sustaining capital expenditures represent capital expenditures for major projects, including major capital development projects at existing operations that are expected to materially benefit the operation, as well as enhancement capital for significant infrastructure improvements at existing operations. Management believes the distinction between sustaining capital expenditures and non-sustaining expenditures is a useful indicator of the purpose of capital expenditures and this distinction is an input into the calculation of attributable all-in sustaining costs per ounce and attributable all-in costs per ounce. The categorization of sustaining capital expenditures and non-sustaining capital expenditures is consistent with the definitions under the WGC all-in cost standard. Sustaining capital expenditures and non-sustaining capital expenditures are not defined under IFRS, however, the sum of these two measures total to additions to property, plant and equipment as disclosed under IFRS on the consolidated statements of cash flows.
Additions to property, plant and equipment per the consolidated statements of cash flows includes 100% of capital expenditures for Manh Choh. Attributable capital expenditures includes Kinross' 70% share of capital expenditures for Manh Choh. Management believes this to be a useful indicator of Kinross’ cash resources utilized for capital expenditures.
The following table provides a reconciliation of the classification of capital expenditures for the periods presented:
| (expressed in millions of U.S. dollars) | ||||||||||||||||||||||
| Three months ended December 31, 2024 | Tasiast (Mauritania) |
Paracatu (Brazil) |
La Coipa (Chile) |
Fort Knox(l) (USA) |
Round Mountain (USA) |
Bald Mountain (USA) |
Total USA |
Other | Total | |||||||||||||
| Sustaining capital expenditures | $ | 33.7 | $ | 35.1 | $ | 26.6 | $ | 53.3 | $ | 4.4 | $ | 4.6 | $ | 62.3 | $ | 0.3 | $ | 158.0 | ||||
| Non-sustaining capital expenditures | 71.7 | - | - | 0.7 | 29.5 | 1.8 | 32.0 | 19.0 | 122.7 | |||||||||||||
| Additions to property, plant and equipment - per cash flow | $ | 105.4 | $ | 35.1 | $ | 26.6 | $ | 54.0 | $ | 33.9 | $ | 6.4 | $ | 94.3 | $ | 19.3 | $ | 280.7 | ||||
| Less: Non-controlling interest(b) | $ | - | $ | - | $ | - | $ | (1.9 | ) | $ | - | $ | - | $ | (1.9 | ) | $ | - | $ | (1.9 | ) | |
| Attributable(a) capital expenditures | $ | 105.4 | $ | 35.1 | $ | 26.6 | $ | 52.1 | $ | 33.9 | $ | 6.4 | $ | 92.4 | $ | 19.3 | $ | 278.8 | ||||
| Three months ended December 31, 2023 | ||||||||||||||||||||||
| Sustaining capital expenditures | $ | 9.7 | $ | 41.6 | $ | 7.0 | $ | 50.6 | $ | 4.6 | $ | 36.3 | $ | 91.5 | $ | 0.3 | $ | 150.1 | ||||
| Non-sustaining capital expenditures | 75.5 | - | 3.9 | 63.5 | 0.2 | 2.5 | 66.2 | 15.6 | 161.2 | |||||||||||||
| Additions to property, plant and equipment - per cash flow | $ | 85.2 | $ | 41.6 | $ | 10.9 | $ | 114.1 | $ | 4.8 | $ | 38.8 | $ | 157.7 | $ | 15.9 | $ | 311.3 | ||||
| Less: Non-controlling interest(b) | $ | - | $ | - | $ | - | $ | (13.6 | ) | $ | - | $ | - | $ | (13.6 | ) | $ | - | $ | (13.6 | ) | |
| Attributable(a) capital expenditures | $ | 85.2 | $ | 41.6 | $ | 10.9 | $ | 100.5 | $ | 4.8 | $ | 38.8 | $ | 144.1 | $ | 15.9 | $ | 297.7 | ||||
| (expressed in millions of U.S. dollars) | ||||||||||||||||||||||
| Year ended December 31, 2024 | Tasiast (Mauritania) |
Paracatu (Brazil) |
La Coipa (Chile) |
Fort Knox(l) (USA) |
Round Mountain (USA) |
Bald Mountain (USA) |
Total USA | Other | Total | |||||||||||||
| Sustaining capital expenditures | $ | 64.3 | $ | 140.5 | $ | 65.8 | $ | 195.2 | $ | 15.4 | $ | 46.4 | $ | 257.0 | $ | (0.7 | ) | $ | 526.9 | |||
| Non-sustaining capital expenditures | 279.6 | - | 3.6 | 97.0 | 110.9 | 3.1 | 211.0 | 54.4 | 548.6 | |||||||||||||
| Additions to property, plant and equipment - per cash flow | $ | 343.9 | $ | 140.5 | $ | 69.4 | $ | 292.2 | $ | 126.3 | $ | 49.5 | $ | 468.0 | $ | 53.7 | $ | 1,075.5 | ||||
| Less: Non-controlling interest(b) | $ | - | $ | - | $ | - | $ | (24.6 | ) | $ | - | $ | - | $ | (24.6 | ) | $ | - | $ | (24.6 | ) | |
| Attributable(a) capital expenditures | $ | 343.9 | $ | 140.5 | $ | 69.4 | $ | 267.6 | $ | 126.3 | $ | 49.5 | $ | 443.4 | $ | 53.7 | $ | 1,050.9 | ||||
| Year ended December 31, 2023 | ||||||||||||||||||||||
| Sustaining capital expenditures | $ | 45.6 | $ | 167.5 | $ | 36.0 | $ | 193.4 | $ | 30.2 | $ | 79.5 | $ | 303.1 | $ | 2.1 | $ | 554.3 | ||||
| Non-sustaining capital expenditures | 263.4 | - | 38.8 | 175.0 | 0.3 | 40.8 | 216.1 | 25.7 | 544.0 | |||||||||||||
| Additions to property, plant and equipment - per cash flow | $ | 309.0 | $ | 167.5 | $ | 74.8 | $ | 368.4 | $ | 30.5 | $ | 120.3 | $ | 519.2 | $ | 27.8 | $ | 1,098.3 | ||||
| Less: Non-controlling interest(b) | $ | - | $ | - | $ | - | $ | (43.3 | ) | $ | - | $ | - | $ | (43.3 | ) | $ | - | $ | (43.3 | ) | |
| Attributable(a) capital expenditures | $ | 309.0 | $ | 167.5 | $ | 74.8 | $ | 325.1 | $ | 30.5 | $ | 120.3 | $ | 475.9 | $ | 27.8 | $ | 1,055.0 | ||||
See pages 31 and 32 for details of the endnotes referenced within the table above.
Endnotes
(a) “Attributable” measures and ratios include Kinross’ share of Manh Choh (70%) cash flows, costs, sales and capital expenditures.
(b) “Non-controlling interest” represents the non-controlling interest portion in Manh Choh (30%) and other subsidiaries for which the Company’s interest is less than 100% for cash flow from operating activities, costs, sales and capital expenditures, as appropriate.
(c) “Silver revenue” represents the portion of metal sales realized from the production of the secondary or by-product metal (i.e. silver). Revenue from the sale of silver, which is produced as a by-product of the process used to produce gold, effectively reduces the cost of gold production.
(d) “Average realized gold price per ounce” is defined as gold revenue divided by total gold ounces sold.
(e) “Production cost of sales per equivalent ounce sold” is defined as production cost of sales divided by total gold equivalent ounces sold.
(f) “General and administrative” expenses are as reported on the consolidated statements of operations, excluding certain impacts which the Company believes are not reflective of the Company’s underlying performance for the reporting period. General and administrative expenses are considered sustaining costs as they are required to be absorbed on a continuing basis for the effective operation and governance of the Company.
(g) “Other operating expense – sustaining” is calculated as “Other operating expense” as reported on the consolidated statements of operations, less the non-controlling interest portion in Manh Choh (30%) and other subsidiaries for which the Company’s interest is less than 100% and other operating and reclamation and remediation expenses related to non-sustaining activities as well as other items not reflective of the underlying operating performance of our business. Other operating expenses are classified as either sustaining or non-sustaining based on the type and location of the expenditure incurred. The majority of other operating expenses that are incurred at existing operations are considered costs necessary to sustain operations, and are therefore, classified as sustaining. Other operating expenses incurred at locations where there is no current operation or related to other non-sustaining activities are classified as non-sustaining.
(h) “Reclamation and remediation – sustaining” is calculated as current period accretion related to reclamation and remediation obligations plus current period amortization of the corresponding reclamation and remediation assets, less the non-controlling interest portion in Manh Choh (30%) and other subsidiaries for which the Company’s interest is less than 100%, and is intended to reflect the periodic cost of reclamation and remediation for currently operating mines. Reclamation and remediation costs for development projects or closed mines are excluded from this amount and classified as non-sustaining.
(i) “Exploration and business development – sustaining” is calculated as “Exploration and business development” expenses as reported on the consolidated statements of operations, less the non-controlling interest portion in Manh Choh (30%) and other subsidiaries for which the Company’s interest is less than 100% and non-sustaining exploration and business development expenses. Exploration expenses are classified as either sustaining or non-sustaining based on a determination of the type and location of the exploration expenditure. Exploration expenditures within the footprint of operating mines are considered costs required to sustain current operations and are therefore included in sustaining costs. Exploration expenditures focused on new ore bodies near existing mines (i.e. brownfield), new exploration projects (i.e. greenfield) or for other generative exploration activity not linked to existing mining operations are classified as non-sustaining. Business development expenses are classified as either sustaining or non-sustaining based on a determination of the type of expense and requirement for general or growth-related operations.
(j) “Additions to property, plant and equipment – sustaining” and “non-sustaining” are as presented on pages 30 and 31 of this news release and include Kinross’ share of Manh Choh’s (70%) sustaining and non-sustaining capital expenditures.
(k) “Lease payments – sustaining” represents the majority of lease payments as reported on the consolidated statements of cash flows and is made up of the principal and financing components of such cash payments, less the non-controlling interest portion in Manh Choh (30%) and other subsidiaries for which the Company’s interest is less than 100%, and non-sustaining lease payments. Lease payments for development projects or closed mines are classified as non-sustaining.
(l) The Fort Knox segment is composed of Fort Knox and Manh Choh for all periods presented.
2024 Annual Mineral Reserve and Resource Statement
Proven and Probable Mineral Reserves
| MINERAL RESERVE AND MINERAL RESOURCE STATEMENT | GOLD | |||||||||||
| PROVEN AND PROBABLE MINERAL RESERVES |
(1,3,4,5,6,7) |
|||||||||||
| Kinross Gold Corporation's Share at December 31, 2024 | ||||||||||||
| Kinross | Proven | Probable | Proven and Probable | |||||||||
| Location | Interest | Tonnes | Grade | Ounces | Tonnes | Grade | Ounces | Tonnes | Grade | Ounces | ||
| (%) | (kt) | (g/t) | (koz) | (kt) | (g/t) | (koz) | (kt) | (g/t) | (koz) | |||
| NORTH AMERICA | ||||||||||||
| Bald Mountain | USA | 100% | 0 | 0.0 | 0 | 55,772 | 0.7 | 1,173 | 55,772 | 0.7 | 1,173 | |
| Fort Knox | USA | 100% | 364 | 1.2 | 14 | 102,893 | 0.4 | 1,262 | 103,257 | 0.4 | 1,276 | |
| Manh Choh | USA | 70% | 307 | 6.4 | 63 | 2,011 | 7.7 | 495 | 2,318 | 7.5 | 558 | |
| Round Mountain | 8 | USA | 100% | 7,710 | 0.4 | 103 | 67,392 | 0.8 | 1,780 | 75,102 | 0.8 | 1,883 |
| SUBTOTAL | 8,381 | 0.7 | 180 | 228,068 | 0.6 | 4,711 | 236,449 | 0.6 | 4,890 | |||
| SOUTH AMERICA | ||||||||||||
| La Coipa | 9 | Chile | 100% | 648 | 1.8 | 38 | 9,878 | 1.9 | 605 | 10,526 | 1.9 | 642 |
| Lobo Marte | 2 | Chile | 100% | 0 | 0.0 | 0 | 160,702 | 1.3 | 6,733 | 160,702 | 1.3 | 6,733 |
| Paracatu | Brazil | 100% | 264,323 | 0.5 | 3,885 | 112,946 | 0.3 | 1,002 | 377,268 | 0.4 | 4,887 | |
| SUBTOTAL | 264,970 | 0.5 | 3,923 | 283,526 | 0.9 | 8,340 | 548,497 | 0.7 | 12,262 | |||
| AFRICA | ||||||||||||
| Tasiast | Mauritania | 100% | 57,361 | 1.1 | 2,000 | 45,471 | 1.9 | 2,705 | 102,831 | 1.4 | 4,705 | |
| SUBTOTAL | 57,361 | 1.1 | 2,000 | 45,471 | 1.9 | 2,705 | 102,831 | 1.4 | 4,705 | |||
| TOTAL GOLD | 330,712 | 0.6 | 6,103 | 557,065 | 0.9 | 15,755 | 887,777 | 0.8 | 21,857 | |||
| MINERAL RESERVE AND MINERAL RESOURCE STATEMENT | SILVER | |||||||||||
| PROVEN AND PROBABLE MINERAL RESERVES |
(1,3,4,5,6,7) |
|||||||||||
| Kinross Gold Corporation's Share at December 31, 2024 | ||||||||||||
| Location | Kinross | Proven | Probable | Proven and Probable | ||||||||
| Interest | Tonnes | Grade | Ounces | Tonnes | Grade | Ounces | Tonnes | Grade | Ounces | |||
| (%) | (kt) | (g/t) | (koz) | (kt) | (g/t) | (koz) | (kt) | (g/t) | (koz) | |||
| NORTH AMERICA | ||||||||||||
| Manh Choh | USA | 70% | 307 | 9.9 | 98 | 2,011 | 14.2 | 916 | 2,318 | 13.6 | 1,014 | |
| SUBTOTAL | 307 | 9.9 | 98 | 2,011 | 14.2 | 916 | 2,318 | 13.6 | 1,014 | |||
| SOUTH AMERICA | ||||||||||||
| La Coipa | 9 | Chile | 100% | 648 | 60.3 | 1,254 | 9,878 | 46.1 | 14,635 | 10,526 | 47.0 | 15,890 |
| SUBTOTAL | 648 | 60.3 | 1,254 | 9,878 | 46.1 | 14,635 | 10,526 | 47.0 | 15,890 | |||
| TOTAL SILVER | 955 | 44.1 | 1,352 | 11,889 | 40.7 | 15,551 | 12,844 | 40.9 | 16,903 | |||
See pages 36 and 37 of this news release for details of the footnotes referenced within the table above.
Measured and Indicated Mineral Resources
| MINERAL RESERVE AND MINERAL RESOURCE STATEMENT | GOLD | |||||||||||
| MEASURED AND INDICATED MINERAL RESOURCES | (3,4,5,6,7,10,11,13) | |||||||||||
| Kinross Gold Corporation's Share at December 31, 2024 | ||||||||||||
| Kinross | Measured | Indicated | Measured and Indicated | |||||||||
| Location | Interest | Tonnes | Grade | Ounces | Tonnes | Grade | Ounces | Tonnes | Grade | Ounces | ||
| (%) | (kt) | (g/t) | (koz) | (kt) | (g/t) | (koz) | (kt) | (g/t) | (koz) | |||
| NORTH AMERICA | ||||||||||||
| Bald Mountain | USA | 100% | 7,131 | 0.9 | 205 | 172,130 | 0.4 | 2,478 | 179,261 | 0.5 | 2,683 | |
| Fort Knox | USA | 100% | 0 | 0.0 | 0 | 67,938 | 0.4 | 810 | 67,938 | 0.4 | 810 | |
| Great Bear Resources | 14 | CAN | 100% | 1,556 | 3.0 | 152 | 28,711 | 2.8 | 2,586 | 30,267 | 2.8 | 2,738 |
| Curlew Basin | USA | 100% | 0 | 0.0 | 0 | 1,993 | 6.4 | 409 | 1,993 | 6.4 | 409 | |
| Manh Choh | USA | 70% | 0 | 0.0 | 0 | 257 | 2.7 | 23 | 257 | 2.7 | 23 | |
| Round Mountain | 8 | USA | 100% | 0 | 0.0 | 0 | 154,965 | 0.7 | 3,625 | 154,965 | 0.7 | 3,625 |
| SUBTOTAL | 8,687 | 1.3 | 357 | 425,994 | 0.7 | 9,931 | 434,681 | 0.7 | 10,288 | |||
| SOUTH AMERICA | ||||||||||||
| La Coipa | 9 | Chile | 100% | 4,017 | 2.1 | 275 | 23,171 | 1.5 | 1,091 | 27,188 | 1.6 | 1,366 |
| Lobo Marte | 12 | Chile | 100% | 0 | 0.0 | 0 | 99,440 | 0.7 | 2,366 | 99,440 | 0.7 | 2,366 |
| Maricunga | Chile | 100% | 66,840 | 0.7 | 1,540 | 227,723 | 0.7 | 4,777 | 294,563 | 0.7 | 6,317 | |
| Paracatu | Brazil | 100% | 98,886 | 0.5 | 1,537 | 191,455 | 0.3 | 1,628 | 290,341 | 0.3 | 3,165 | |
| SUBTOTAL | 169,743 | 0.6 | 3,353 | 541,790 | 0.6 | 9,862 | 711,532 | 0.6 | 13,214 | |||
| AFRICA | ||||||||||||
| Tasiast | Mauritania | 100% | 21,295 | 0.7 | 478 | 53,255 | 1.1 | 1,887 | 74,550 | 1.0 | 2,365 | |
| SUBTOTAL | 21,295 | 0.7 | 478 | 53,255 | 1.1 | 1,887 | 74,550 | 1.0 | 2,365 | |||
| TOTAL GOLD | 199,725 | 0.7 | 4,187 | 1,021,039 | 0.7 | 21,679 | 1,220,764 | 0.7 | 25,867 | |||
| MINERAL RESERVE AND MINERAL RESOURCE STATEMENT | SILVER | |||||||||||
| MEASURED AND INDICATED MINERAL RESOURCES | (3,4,5,6,7,10,11,13) | |||||||||||
| Kinross Gold Corporation's Share at December 31, 2024 | ||||||||||||
| Location | Kinross | Measured | Indicated | Measured and Indicated | ||||||||
| Interest | Tonnes | Grade | Ounces | Tonnes | Grade | Ounces | Tonnes | Grade | Ounces | |||
| (%) | (kt) | (g/t) | (koz) | (kt) | (g/t) | (koz) | (kt) | (g/t) | (koz) | |||
| NORTH AMERICA | ||||||||||||
| Manh Choh | USA | 70% | 0 | 0.0 | 0 | 257 | 10.4 | 86 | 257 | 10.4 | 86 | |
| Round Mountain | 8 | USA | 100% | 0 | 0.0 | 0 | 4,085 | 8.4 | 1,106 | 4,085 | 8.4 | 1,106 |
| SUBTOTAL | 0 | 0.0 | 0 | 4,341 | 8.5 | 1,192 | 4,341 | 8.5 | 1,192 | |||
| SOUTH AMERICA | ||||||||||||
| La Coipa | 9 | Chile | 100% | 4,017 | 36.6 | 4,727 | 23,171 | 41.2 | 30,699 | 27,188 | 40.5 | 35,426 |
| SUBTOTAL | 4,017 | 36.6 | 4,727 | 23,171 | 41.2 | 30,699 | 27,188 | 40.5 | 35,426 | |||
| TOTAL SILVER | 4,017 | 36.6 | 4,727 | 27,512 | 36.1 | 31,891 | 31,529 | 36.1 | 36,618 | |||
See pages 36 and 37 of this news release for details of the footnotes referenced within the table above.
Inferred Mineral Resources
| MINERAL RESERVE AND MINERAL RESOURCE STATEMENT | GOLD | ||||||
|
INFERRED MINERAL RESOURCES |
(3,4,5,6,7,10,11,13) |
||||||
| Kinross Gold Corporation's Share at December 31, 2024 | |||||||
| Kinross | Inferred | ||||||
| Location | Interest | Tonnes | Grade | Ounces | |||
| (%) | (kt) | (g/t) | (koz) | ||||
| NORTH AMERICA | |||||||
| Bald Mountain | USA | 100% | 51,303 | 0.3 | 571 | ||
| Fort Knox | USA | 100% | 15,203 | 0.4 | 187 | ||
| Great Bear Resources | 14 | CAN | 100% | 25,480 | 4.7 | 3,884 | |
| Curlew Basin | USA | 100% | 4,151 | 6.3 | 838 | ||
| Manh Choh | USA | 70% | 0 | 3.2 | 0 | ||
| Round Mountain | 8 | USA | 100% | 112,844 | 0.5 | 1,669 | |
| SUBTOTAL | 208,981 | 1.1 | 7,149 | ||||
| SOUTH AMERICA | |||||||
| La Coipa | 9 | Chile | 100% | 2,190 | 1.3 | 92 | |
| Lobo Marte | 12 | Chile | 100% | 18,474 | 0.7 | 445 | |
| Maricunga | Chile | 100% | 212,306 | 0.6 | 3,854 | ||
| Paracatu | Brazil | 100% | 2,275 | 0.3 | 21 | ||
| SUBTOTAL | 235,244 | 0.6 | 4,412 | ||||
| AFRICA | |||||||
| Tasiast | Mauritania | 100% | 21,047 | 2.4 | 1,632 | ||
| SUBTOTAL | 21,047 | 2.4 | 1,632 | ||||
| TOTAL GOLD | 465,272 | 0.9 | 13,193 | ||||
| MINERAL RESERVE AND MINERAL RESOURCE STATEMENT | SILVER | ||||||
| INFERRED MINERAL RESOURCES | (3,4,5,6,7,10,11,13) | ||||||
| Kinross Gold Corporation's Share at December 31, 2024 | |||||||
| Kinross | Inferred | ||||||
| Location | Interest | Tonnes | Grade | Ounces | |||
| (%) | (kt) | (g/t) | (koz) | ||||
| NORTH AMERICA | |||||||
| Manh Choh | USA | 70% | 0 | 45.8 | 1 | ||
| Round Mountain | 8 | USA | 100% | 330 | 1.1 | 12 | |
| SUBTOTAL | 330 | 1.2 | 12 | ||||
| SOUTH AMERICA | |||||||
| La Coipa | 9 | Chile | 100% | 2,190 | 53.8 | 3,790 | |
| SUBTOTAL | 2,190 | 53.8 | 3,790 | ||||
| TOTAL SILVER | 2,519 | 46.9 | 3,803 | ||||
See pages 36 and 37 of this news release for details of the footnotes referenced within the table above.
Mineral Reserve and Mineral Resource Statement Notes
(1) Unless otherwise noted, the Company's mineral reserves are estimated using appropriate cut-off grades based on an assumed gold price of $1,600 per ounce and a silver price of $20.00 per ounce. Mineral reserves are estimated using appropriate process recoveries, operating costs and mine plans that are unique to each property and include estimated allowances for dilution and mining recovery. Mineral reserve estimates are reported in contained units based on Kinross' interest and are estimated based on the following foreign exchange rates:
Canadian Dollar to $US 1.35
Chilean Peso to $US 900.00
Brazilian Real to $US 5.25
Mauritanian Ouguiya to $US 37.50
(2) The mineral reserve estimates for Lobo Marte assume a $1,200 per ounce gold price and foreign exchange rate assumption of Chilean Peso to $US 800.00 are based on the 2021 Feasibility Study.
(3) The Company’s mineral reserve and mineral resource estimates as at December 31, 2024 are classified in accordance with the Canadian Institute of Mining, Metallurgy and Petroleum (“CIM”) “CIM Definition Standards ‑ For Mineral Resources and Mineral Reserves” adopted by the CIM Council (as amended, the “CIM Definition Standards”) in accordance with the requirements of National Instrument 43‑101 “Standards of Disclosure for Mineral Projects” (“NI 43‑101”). Mineral reserve and mineral resource estimates reflect the Company’s reasonable expectation that all necessary permits and approvals will be obtained and maintained.
(4) Cautionary note to U.S. investors concerning estimates of mineral reserves and mineral resources. These estimates have been prepared in accordance with the requirements of Canadian securities laws, which differ from the requirements of United States’ securities laws. The terms “mineral reserve”, “proven mineral reserve”, “probable mineral reserve”, “mineral resource”, “measured mineral resource”, “indicated mineral resource” and “inferred mineral resource” are Canadian mining terms as defined in accordance with NI 43 101 and the CIM Definition Standards. These definitions differ from the definitions in subpart 1300 of Regulation S K (“Subpart 1300”). While the definitions in Subpart 1300 are similar to the definitions in NI 43 101 and the CIM Definitions Standard, the definitions in Subpart 1300 differ from the requirements of, and the definitions in, NI 43 101 and the CIM Definition Standards. U.S. investors are cautioned that while the above terms are “substantially similar” to CIM Definitions, there are differences in the definitions in Subpart 1300 and the CIM Definition Standards. Accordingly, there is no assurance any mineral reserves or mineral resources that the Company may report as “proven mineral reserves”, “probable mineral reserves”, “measured mineral resources”, “indicated mineral resources” and “inferred mineral resources” under NI 43 101 would be the same had the Company prepared the mineral reserve or mineral resource estimates under the standards set forth in Subpart 1300. U.S. investors are also cautioned that while the United States Securities and Exchange Commission (“SEC”) recognizes “measured mineral resources”, “indicated mineral resources” and “inferred mineral resources” under Subpart 1300, investors should not assume that any part or all of the mineralization in these categories will ever be converted into a higher category of mineral resources or into mineral reserves. Mineralization described using these terms has a greater amount of uncertainty as to its existence and feasibility than mineralization that has been characterized as reserves. Accordingly, investors are cautioned not to assume that any measured mineral resources, indicated mineral resources, or inferred mineral resources that the Company reports are or will be economically or legally mineable. Further, “inferred mineral resources” have a greater amount of uncertainty as to their existence and as to whether they can be mined legally or economically. Therefore, U.S. investors are also cautioned not to assume that all or any part of the “inferred mineral resources” exist. Under Canadian securities laws, estimates of “inferred mineral resources” may not form the basis of feasibility or pre-feasibility studies, except in rare cases. As a foreign private issuer that files its annual report on Form 40 F with the SEC pursuant to the multi-jurisdictional disclosure system, the Company is not required to provide disclosure on its mineral properties under the Subpart 1300 provisions and will continue to provide disclosure under NI 43 101 and the CIM Definition Standards. If the Company ceases to be a foreign private issuer or loses its eligibility to file its annual report on Form 40 F pursuant to the multi-jurisdictional disclosure system, then the Company will be subject to reporting pursuant to the Subpart 1300 provisions, which differ from the requirements of NI 43 101 and the CIM Definition Standards.
For the above reasons, the mineral reserve and mineral resource estimates and related information in this news release may not be comparable to similar information made public by U.S. companies subject to the reporting and disclosure requirements under the United States federal securities laws and the rules and regulations thereunder.
(5) The Company’s mineral resource and mineral reserve estimates were prepared under the supervision of and verified by Mr. Nicos Pfeiffer, who is a qualified person as defined by NI 43‑101.
(6) The Company’s normal data verification procedures have been used in collecting, compiling, interpreting and processing the data used to estimate mineral reserves and mineral resource.
(7) Rounding of values to the 000s may result in apparent discrepancies.
(8) Round Mountain refers to the Round Mountain project, which includes the Round Mountain deposit and the Gold Hill deposit. The Round Mountain deposit does not contain silver and all silver resources at Round Mountain are contained exclusively within the Gold Hill deposit. Disclosure of gold mineral reserves and mineral resources reflect both the Round Mountain deposit and the Gold Hill deposit. Disclosure of silver mineral reserves and mineral resources reflect only the Gold Hill deposit.
(9) Includes mineral resources and mineral reserves from the Puren deposit in which the Company holds a 65% interest; as well as mineral resources from the Catalina deposit, in which the Company holds a 50% interest.
(10) Mineral resources are exclusive of mineral reserves.
(11) Unless otherwise noted, the Company’s mineral resources are estimated using appropriate cut-off grades based on a gold price of $2,000 per ounce and a silver price of $25.00 per ounce. Foreign exchange rates for estimating mineral resources were the same as for mineral reserves.
(12) The mineral resource estimates for Lobo Marte assume a $1,600 per ounce gold price and are based on the 2021 Feasibility Study.
(13) Mineral resources that are not mineral reserves do not have to demonstrate economic viability. Mineral resources are subject to infill drilling, permitting, mine planning, mining dilution and recovery losses, among other things, to be converted into mineral reserves. Due to the uncertainty associated with inferred mineral resources, it cannot be assumed that all or any part of an inferred mineral resource will ever be upgraded to indicated or measured mineral resources, including as a result of continued exploration.
(14) The mineral resource estimates for Great Bear assume a $1,700 per ounce gold price and foreign exchange rate assumption of 1.35 CAD per 1.00 USD and are based on the 2024 Preliminary Economic Assessment.
Mineral Reserve and Mineral Resource Definitions
A ‘Mineral Resource’ is a concentration or occurrence of solid material of economic interest in or on the Earth’s crust in such form, grade or quality and quantity that there are reasonable prospects for eventual economic extraction. The location, quantity, grade or quality, continuity and other geological characteristics of a Mineral Resource are known, estimated or interpreted from specific geological evidence and knowledge, including sampling.
An ‘Inferred Mineral Resource’ is that part of a Mineral Resource for which quantity and grade or quality are estimated on the basis of limited geological evidence and sampling. Geological evidence is sufficient to imply but not verify geological and grade or quality continuity. An Inferred Mineral Resource has a lower level of confidence than that applying to an Indicated Mineral Resource and must not be converted to a Mineral Reserve. It is reasonably expected that the majority of Inferred Mineral Resources could be upgraded to Indicated Mineral Resources with continued exploration.
An ‘Indicated Mineral Resource’ is that part of a Mineral Resource for which quantity, grade or quality, densities, shape and physical characteristics are estimated with sufficient confidence to allow the application of Modifying Factors in sufficient detail to support mine planning and evaluation of the economic viability of the deposit. Geological evidence is derived from adequately detailed and reliable exploration, sampling and testing and is sufficient to assume geological and grade or quality continuity between points of observation. An Indicated Mineral Resource has a lower level of confidence than that applying to a Measured Mineral Resource and may only be converted to a Probable Mineral Reserve.
A ‘Measured Mineral Resource’ is that part of a Mineral Resource for which quantity, grade or quality, densities, shape, and physical characteristics are estimated with confidence sufficient to allow the application of Modifying Factors to support detailed mine planning and final evaluation of the economic viability of the deposit. Geological evidence is derived from detailed and reliable exploration, sampling and testing and is sufficient to confirm geological and grade or quality continuity between points of observation. A Measured Mineral Resource has a higher level of confidence than that applying to either an Indicated Mineral Resource or an Inferred Mineral Resource. It may be converted to a Proven Mineral Reserve or to a Probable Mineral Reserve.
A ‘Mineral Reserve’ is the economically mineable part of a Measured and/or Indicated Mineral Resource. It includes diluting materials and allowances for losses, which may occur when the material is mined or extracted and is defined by studies at Pre-Feasibility or Feasibility level as appropriate that include application of Modifying Factors. Such studies demonstrate that, at the time of reporting, extraction could reasonably be justified. The reference point at which Mineral Reserves are defined, usually the point where the ore is delivered to the processing plant, must be stated. It is important that, in all situations where the reference point is different, such as for a saleable product, a clarifying statement is included to ensure that the reader is fully informed as to what is being reported. The public disclosure of a Mineral Reserve must be demonstrated by a Pre-Feasibility Study or Feasibility Study.
A ‘Probable Mineral Reserve’ is the economically mineable part of an Indicated, and in some circumstances, a Measured Mineral Resource. The confidence in the Modifying Factors applying to a Probable Mineral Reserve is lower than that applying to a Proven Mineral Reserve.
A ‘Proven Mineral Reserve’ is the economically mineable part of a Measured Mineral Resource. A Proven Mineral Reserve implies a high degree of confidence in the Modifying Factors.
APPENDIX A
Figure 1: At Round Mountain Phase X, drilling results for the upper zone continue to show good grades and strong widths.
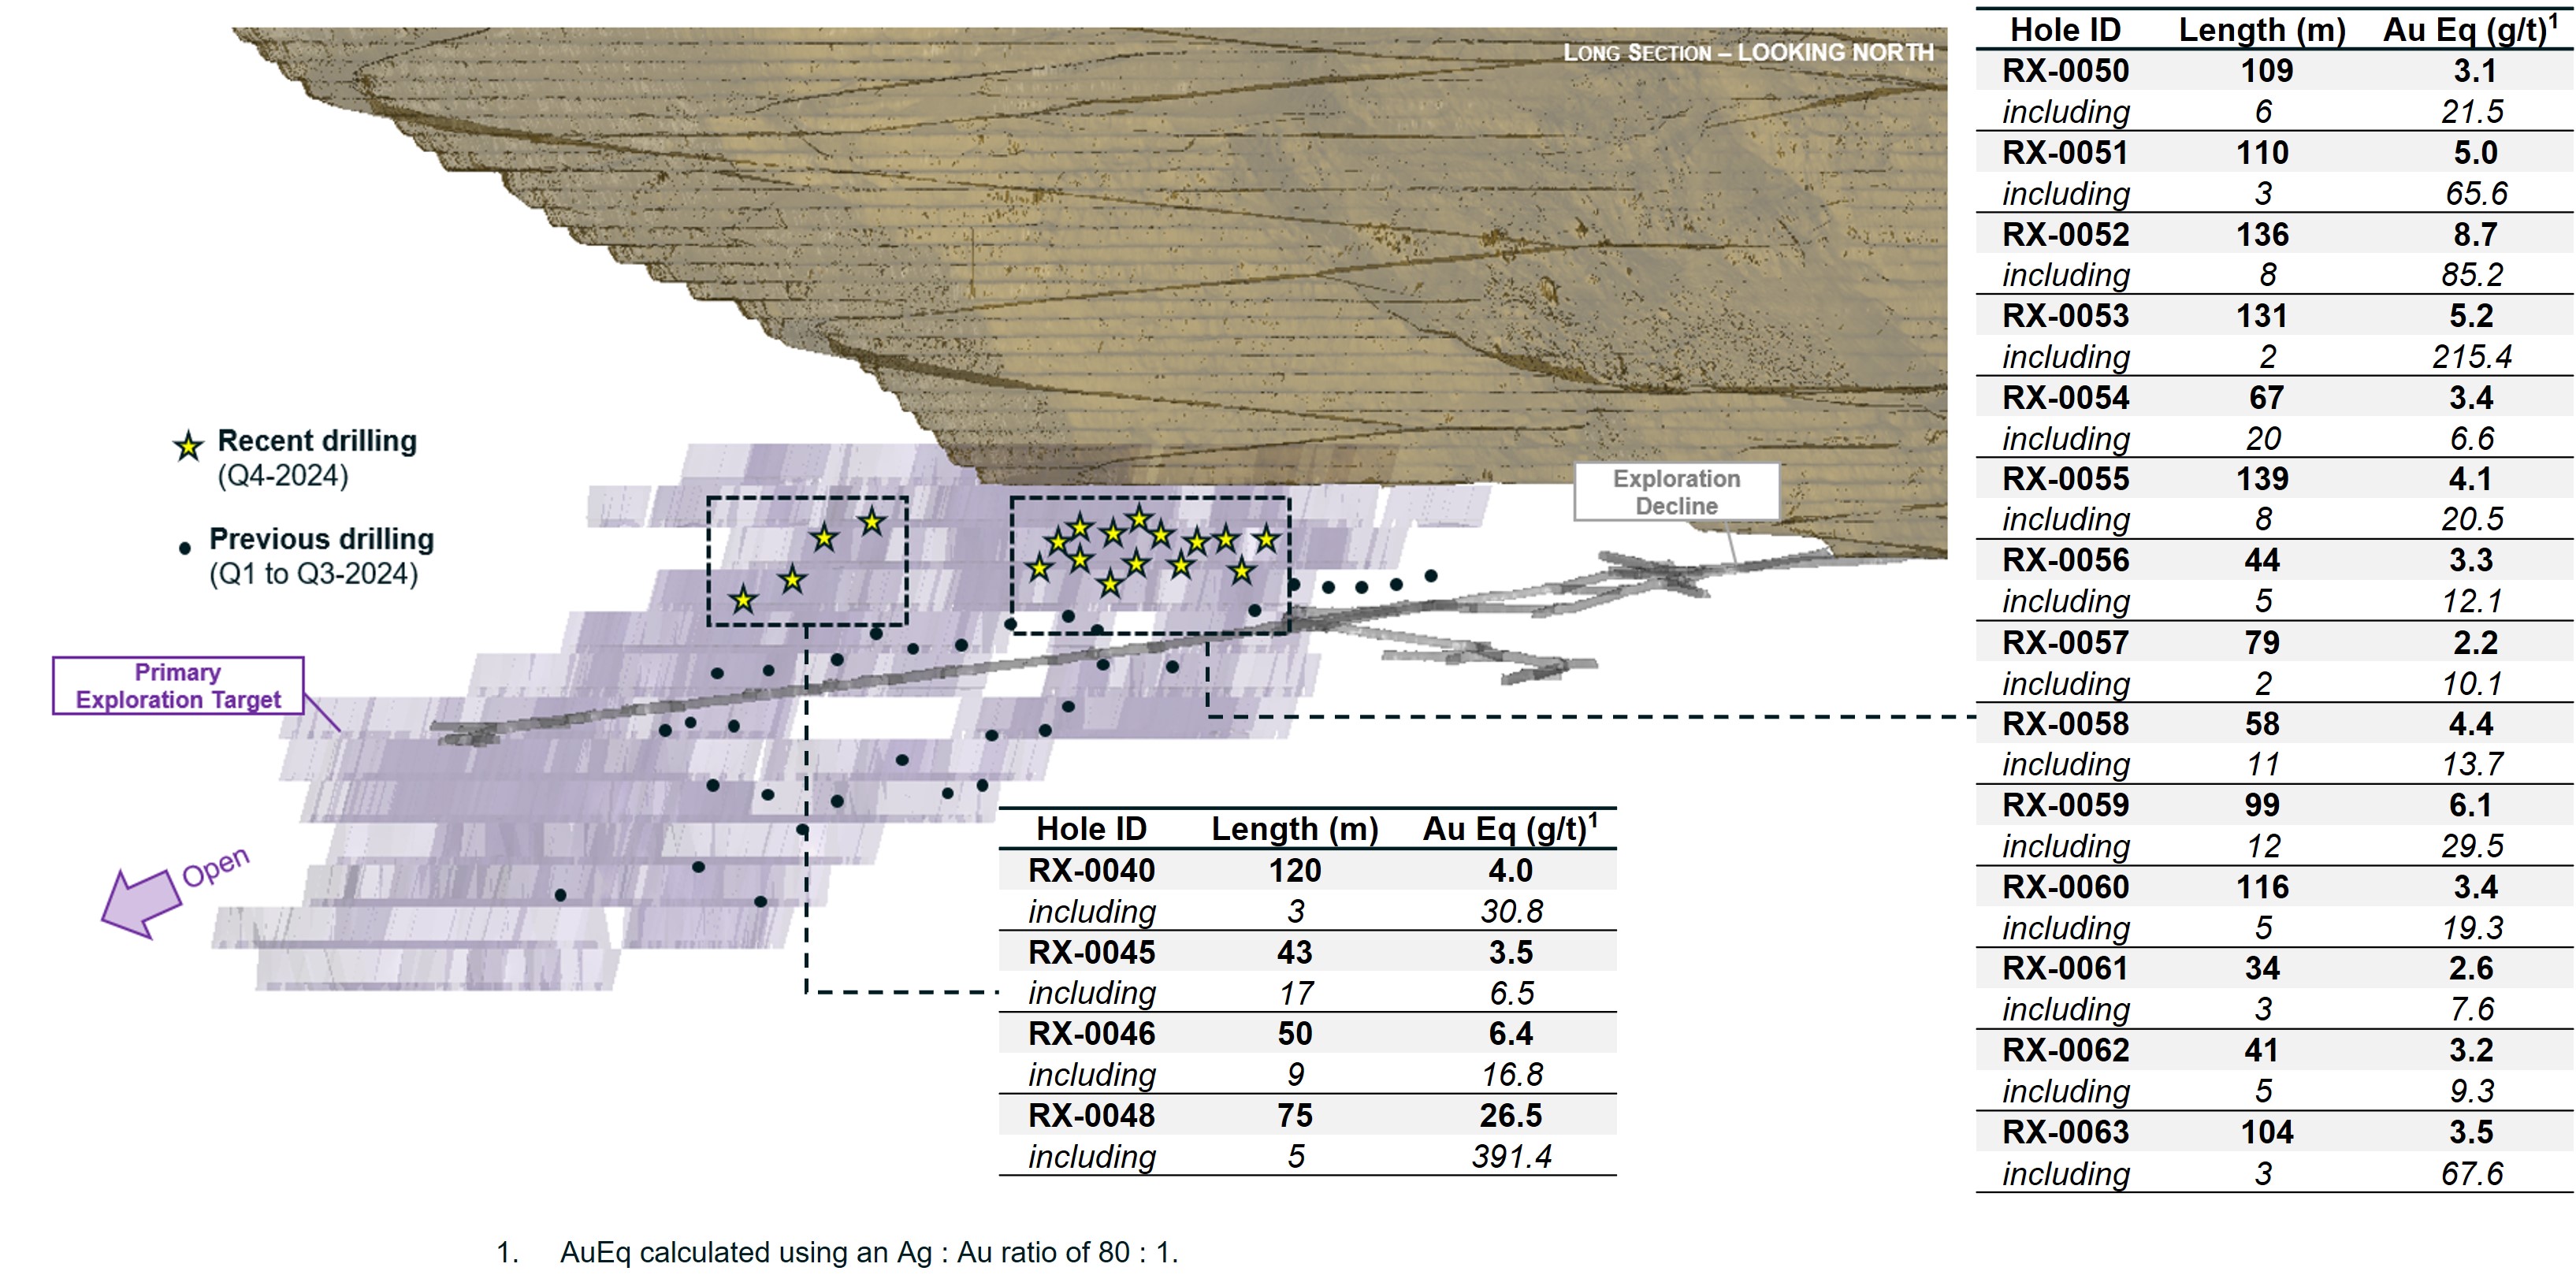
Figure 2: High-grade resource growth at Curlew Basin
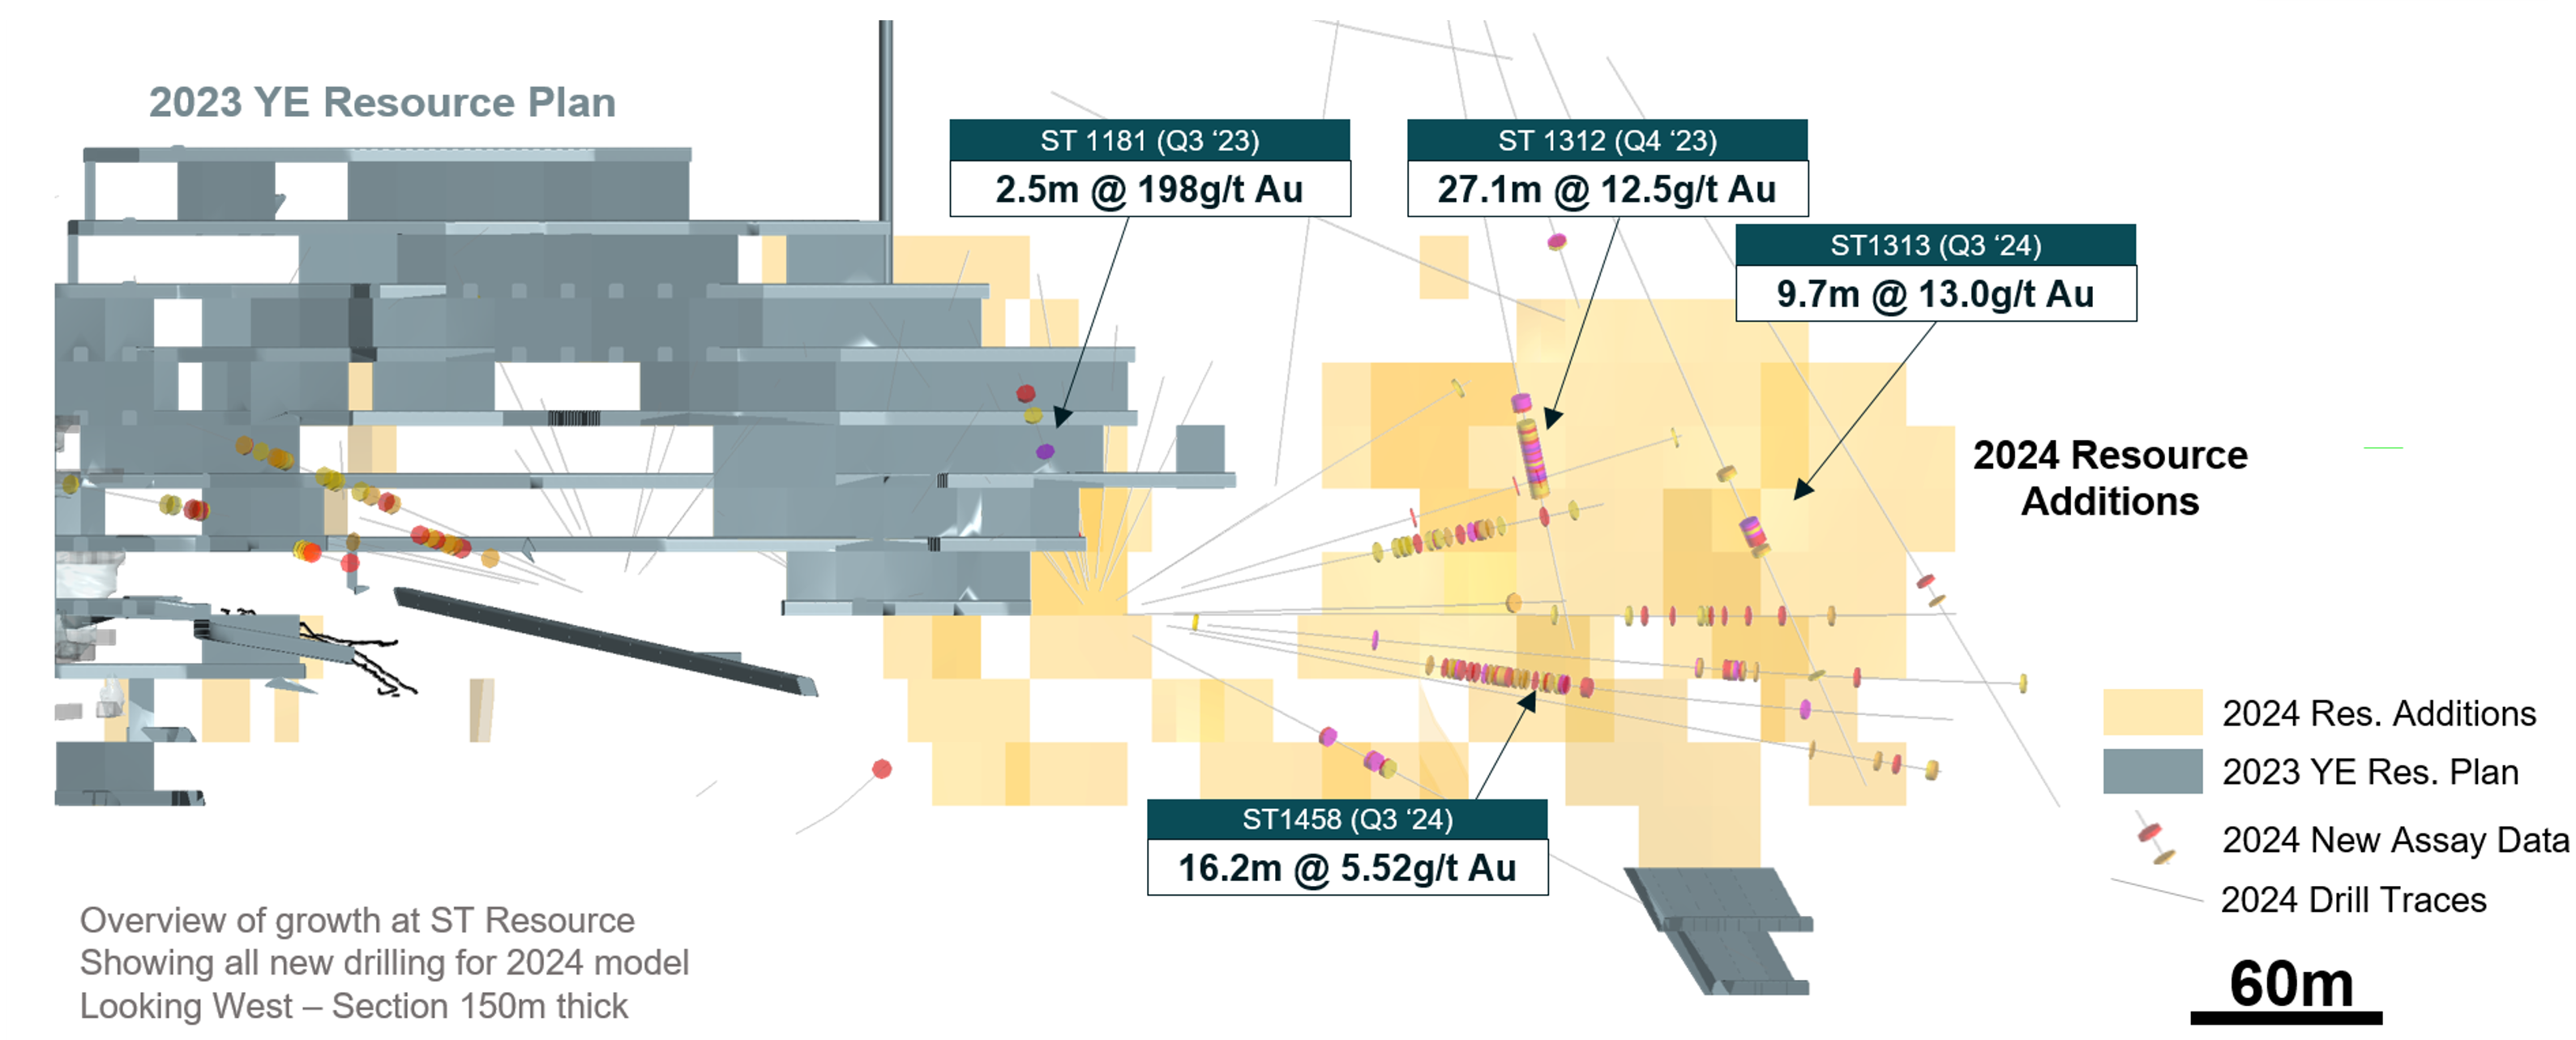
Cautionary statement on forward-looking information
All statements, other than statements of historical fact, contained or incorporated by reference in this news release including, but not limited to, any information as to the future financial or operating performance of Kinross, constitute “forward-looking information” or “forward-looking statements” within the meaning of certain securities laws, including the provisions of the Securities Act (Ontario) and the provisions for “safe harbor” under the United States Private Securities Litigation Reform Act of 1995 and are based on expectations, estimates and projections as of the date of this news release. Forward-looking statements contained in this news release, include, but are not limited to, those under the headings (or headings that include) “2024 full-year results and 2025 guidance”, “CEO commentary”, “Return of Capital”, “Operating Results”, “Development Projects ”, “Company Guidance”, and “Exploration Update”, as well as statements with respect to our guidance for production, cost guidance, including production costs of sales, all-in sustaining cost of sales, and capital expenditures; statements with respect to our forecasts for cash flow and free cash flow; the declaration, payment and sustainability of the Company’s dividends; the implementation of a share buyback; identification of additional resources and reserves or the conversion of resources to reserves; the Company’s liquidity; the Company’s plan to reduce debt; the schedules budgets, and forecast economics for the Company’s development projects; budgets for and future plans for exploration, development and operation at the Company’s operations and projects, including the Great Bear project; the projected yearly gold production profile from both open pit and underground operations, all-in sustaining costs, mill throughput and average grades at the Great Bear project; potential mine life extensions at the Company’s operations; the Company’s balance sheet and liquidity outlook, as well as references to other possible events including, the future price of gold and silver, costs of production, operating costs; price inflation; capital expenditures, costs and timing of the development of projects and new deposits, estimates and the realization of such estimates (such as mineral or gold reserves and resources or mine life), success of exploration, development and mining, currency fluctuations, capital requirements, project studies, government regulation, permit applications, environmental risks and proceedings, and resolution of pending litigation. The words “advance”, “continue”, “expects”, “focus”, “goal”, “guidance”, “on plan”, “on track”, “opportunity”, “plan”, “potential”, “priority”, “progress”, “target”, “upside”, “view”, or variations of or similar such words and phrases or statements that certain actions, events or results may, could, should or will be achieved, received or taken, or will occur or result and similar such expressions identify forward-looking statements. Forward-looking statements are necessarily based upon a number of estimates and assumptions that, while considered reasonable by Kinross as of the date of such statements, are inherently subject to significant business, economic and competitive uncertainties and contingencies. The estimates, models and assumptions of Kinross referenced, contained or incorporated by reference in this news release, which may prove to be incorrect, include, but are not limited to, the various assumptions set forth herein and in our Management’s Discussion and Analysis (“MD&A”) for the year ended December 31, 2024, and the Annual Information Form dated March 27, 2024 as well as: (1) there being no significant disruptions affecting the operations of the Company, whether due to extreme weather events (including, without limitation, excessive snowfall, excessive or lack of rainfall) and other or related natural disasters, labour disruptions (including but not limited to strikes or workforce reductions), supply disruptions, power disruptions, damage to equipment, pit wall slides or otherwise; (2) permitting, development, operations and production from the Company’s operations and development projects being consistent with Kinross’ current expectations including, without limitation: the maintenance of existing permits and approvals and the timely receipt of all permits and authorizations necessary for construction and operations; water and power supply and continued operation of the tailings reprocessing facility at Paracatu; permitting of the Great Bear project (including the consultation process with Indigenous groups), permitting and development of the Lobo-Marte project; in each case in a manner consistent with the Company’s expectations; and the successful completion of exploration consistent with the Company’s expectations at the Company’s projects; (3) political and legal developments in any jurisdiction in which the Company operates being consistent with its current expectations including, without limitation, restrictions or penalties imposed, or actions taken, by any government, including but not limited to amendments to the mining laws, and potential power rationing and tailings facility regulations in Brazil (including those related to financial assurance requirements), potential amendments to water laws and/or other water use restrictions and regulatory actions in Chile, new dam safety regulations, potential amendments to minerals and mining laws and energy levies laws, new regulations relating to work permits, potential amendments to customs and mining laws (including but not limited to amendments to the VAT) and the potential application of the tax code in Mauritania, potential amendments to and enforcement of tax laws in Mauritania (including, but not limited to, the interpretation, implementation, application and enforcement of any such laws and amendments thereto), potential third party legal challenges to existing permits, and the impact of any trade tariffs being consistent with Kinross’ current expectations; (4) the completion of studies and the results of those studies being consistent with Kinross’ current expectations; (5) the exchange rate between the Canadian dollar, Brazilian real, Chilean peso, Mauritanian ouguiya and the U.S. dollar being approximately consistent with current levels; (6) certain price assumptions for gold and silver; (7) prices for diesel, natural gas, fuel oil, electricity and other key supplies being approximately consistent with the Company’s expectations; (8) attributable production and cost of sales forecasts for the Company meeting expectations; (9) the accuracy of the current mineral reserve and mineral resource estimates of the Company and Kinross’ analysis thereof being consistent with expectations (including but not limited to ore tonnage and ore grade estimates), future mineral resource and mineral reserve estimates being consistent with preliminary work undertaken by the Company, mine plans for the Company’s current and future mining operations, and the Company’s internal models; (10) labour and materials costs increasing on a basis consistent with Kinross’ current expectations; (11) the terms and conditions of the legal and fiscal stability agreements for Tasiast being interpreted and applied in a manner consistent with their intent and Kinross’ expectations and without material amendment or formal dispute (including without limitation the application of tax, customs and duties exemptions and royalties); (12) asset impairment potential; (13) the regulatory and legislative regime regarding mining, electricity production and transmission (including rules related to power tariffs) in Brazil being consistent with Kinross’ current expectations; (14) access to capital markets, including but not limited to maintaining our current credit ratings consistent with the Company’s current expectations; (15) potential direct or indirect operational impacts resulting from infectious diseases or pandemics; (16) changes in national and local government legislation or other government actions, including the Canadian federal impact assessment regime; (17) litigation, regulatory proceedings and audits, and the potential ramifications thereof, being concluded in a manner consistent with the Corporation’s expectations (including without limitation litigation in Chile relating to the alleged damage of wetlands and the scope of any remediation plan or other environmental obligations arising therefrom); (18) the Company’s financial results, cash flows and future prospects being consistent with Company expectations in amounts sufficient to permit sustained dividend payments; and (19) the impacts of geotechnical instability at Round Mountain and Bald Mountain being consistent with the Company’s expectations. Known and unknown factors could cause actual results to differ materially from those projected in the forward-looking statements. Such factors include, but are not limited to: the inaccuracy of any of the foregoing assumptions; fluctuations in the currency markets; fluctuations in the spot and forward price of gold or certain other commodities (such as fuel and electricity); price inflation of goods and services; changes in the discount rates applied to calculate the present value of net future cash flows based on country-specific real weighted average cost of capital; changes in the market valuations of peer group gold producers and the Company, and the resulting impact on market price to net asset value multiples; changes in various market variables, such as interest rates, foreign exchange rates, gold or silver prices and lease rates, or global fuel prices, that could impact the mark-to-market value of outstanding derivative instruments and ongoing payments/receipts under any financial obligations; risks arising from holding derivative instruments (such as credit risk, market liquidity risk and mark-to-market risk); changes in national and local government legislation, taxation (including but not limited to income tax, advance income tax, stamp tax, withholding tax, capital tax, tariffs, value-added or sales tax, capital outflow tax, capital gains tax, windfall or windfall profits tax, production royalties, excise tax, customs/import or export taxes/duties, asset taxes, asset transfer tax, property use or other real estate tax, together with any related fine, penalty, surcharge, or interest imposed in connection with such taxes), controls, tariffs, policies and regulations; the security of personnel and assets; political or economic developments in Canada, the United States, Chile, Brazil, Mauritania or other countries in which Kinross does business or may carry on business; business opportunities that may be presented to, or pursued by, us; our ability to successfully integrate acquisitions and complete divestitures; operating or technical difficulties in connection with mining, development or refining activities; employee relations; litigation or other claims against, or regulatory investigations and/or any enforcement actions, administrative orders or sanctions in respect of the Company (and/or its directors, officers, or employees) including, but not limited to, securities class action litigation in Canada and/or the United States, environmental litigation or regulatory proceedings or any investigations, enforcement actions and/or sanctions under any applicable anti-corruption, international sanctions and/or anti-money laundering laws and regulations in Canada, the United States or any other applicable jurisdiction; the speculative nature of gold exploration and development including, but not limited to, the risks of obtaining and maintaining necessary licenses and permits; diminishing quantities or grades of reserves; adverse changes in our credit ratings; and contests over title to properties, particularly title to undeveloped properties. In addition, there are risks and hazards associated with the business of gold exploration, development and mining, including environmental hazards, industrial accidents, unusual or unexpected formations, pressures, cave-ins, flooding and gold bullion losses (and the risk of inadequate insurance, or the inability to obtain insurance, to cover these risks). Many of these uncertainties and contingencies can directly or indirectly affect, and could cause, Kinross’ actual results to differ materially from those expressed or implied in any forward-looking statements made by, or on behalf of, Kinross, including but not limited to resulting in an impairment charge on goodwill and/or assets. There can be no assurance that forward-looking statements will prove to be accurate, as actual results and future events could differ materially from those anticipated in such statements. Forward-looking statements are provided for the purpose of providing information about management’s expectations and plans relating to the future. All of the forward-looking statements made in this news release are qualified by this cautionary statement and those made in our other filings with the securities regulators of Canada and the United States including, but not limited to, the cautionary statements made in the “Risk Analysis” section of our MD&A for the year ended December 31, 2024, and the “Risk Factors” set forth in the Company’s Annual Information Form dated March 27, 2024. These factors are not intended to represent a complete list of the factors that could affect Kinross. Kinross disclaims any intention or obligation to update or revise any forward-looking statements or to explain any material difference between subsequent actual events and such forward-looking statements, except to the extent required by applicable law.
Key Sensitivities
Approximately 70%-80% of the Company's costs are denominated in U.S. dollars.
A 10% change in foreign currency exchange rates would be expected to result in an approximate $25 impact on attributable production cost of sales per equivalent ounce sold1,21.
Specific to the Brazilian real, a 10% change in the exchange rate would be expected to result in an approximate $45 impact on Brazilian attributable production cost of sales per equivalent ounce sold1.
Specific to the Chilean peso, a 10% change in the exchange rate would be expected to result in an approximate $50 impact on Chilean attributable production cost of sales per equivalent ounce sold1.
A $10 per barrel change in the price of oil would be expected to result in an approximate $3 impact on attributable production cost of sales per equivalent ounce sold1.
A $100 change in the price of gold would be expected to result in an approximate $5 impact on attributable production cost of sales per equivalent ounce sold1 as a result of a change in royalties.
________________________
21 Refers to all of the currencies in the countries where the Company has mining operations, fluctuating simultaneously by 10% in the same direction, either appreciating or depreciating, taking into consideration the impact of hedging and the weighting of each currency within our consolidated cost structure.
Other information
Where we say "we", "us", "our", the "Company", or "Kinross" in this news release, we mean Kinross Gold Corporation and/or one or more or all of its subsidiaries, as may be applicable.
The technical information about the Company’s mineral properties contained in this news release has been prepared under the supervision of Mr. Nicos Pfeiffer, an officer of the Company who is a “qualified person” within the meaning of National Instrument 43-101.
A graph accompanying this announcement is available at: https://www.globenewswire.com/NewsRoom/AttachmentNg/f7cb922d-afc1-4710-8509-004f22627824
Figures accompanying this announcement are available at:
https://www.globenewswire.com/NewsRoom/AttachmentNg/c2f65686-4e39-4727-b0da-8d4a4efe33e6
https://www.globenewswire.com/NewsRoom/AttachmentNg/95aee9dc-04ab-4413-acd4-3ddc5fc57ab0
Source: Kinross Gold Corporation

![]()
Tasiast reserve and mine plan update
At Tasiast, a new life of mine plan has been completed following the 2024 reserve update.
Appendix A - Round Mountain Phase X
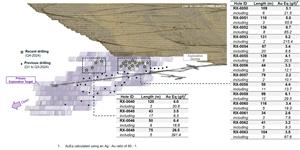
Figure 1: At Round Mountain Phase X, drilling results for the upper zone continue to show good grades and strong widths.
Appendix A: Curlew Basin
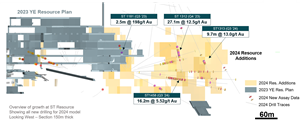
Figure 2: High-grade resource growth at Curlew Basin
Distribution channels: Business & Economy, Mining Industry ...
Legal Disclaimer:
EIN Presswire provides this news content "as is" without warranty of any kind. We do not accept any responsibility or liability for the accuracy, content, images, videos, licenses, completeness, legality, or reliability of the information contained in this article. If you have any complaints or copyright issues related to this article, kindly contact the author above.
Submit your press release